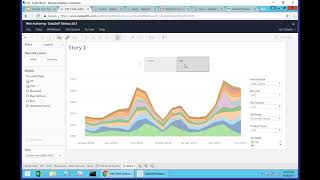
Video tutorial (DataSelf AI) demonstrating Tableau 10.3 Stories feature in the web browser: how to create a new story using the new "New" button (New Sheet, New Dashboard, New Story), add story steps (queries, maps, cost-of-sales view), rename a story, change layout to show numbers, and use the new dot-style navigation introduced in 10.3 (smaller footprint than 10.2).
Chapters
For many of you. If you're using Stories now, Stories is also available on the web browser. You can create new stories. Before you couldn't. So now you just come here. There is this new button for stories. You know, this is new sheet, new dashboard, new story. So click this button to create a new story. I'll call first step of my story. I'm going to add one of these queries. So double click one of the queries and then let me make this just a little smaller. And let's add a second step. So one more step, I'm going to put this particular query here. This would be cost of sales. And I'm just going to create another one and put the map. So I just created Story. I'm going to call this story my new story. Stories are like in PowerPoint. As you're browsing them, you can come here and just use this to go from page to page. You can change the layout to show numbers instead. You might have several steps to tell your story. And in 10.3, there's also the dots approach. Dots was not available in 10.2, so pretty much makes the whole view more streamlined with less real estate being used by the navigation capabilities. So.