Tableau and DataSelf - Analytics and BI
Johnny Girardi, DataSelf's founder, walks through building a data warehouse with SQL Server and DataSelf ETL, then visualizing it in Tableau. DataSelf ships with 5,000+ pre-built reports and templates. The demo shows how to drag and drop dashboards, filter data, and schedule reports.
Chapters
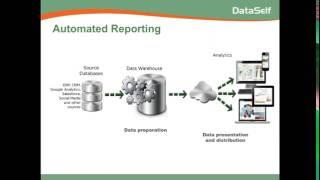
Alrighty, let's get started. Good morning everyone. My name is Johnny Girardi. I'm Data Self founder and CEO and today we'll talk about BI and Analytics and we'll be focusing on Tableau and Data Self. So let's get started. The way I'm going to cover the content today is first of all, I want to give good content, educational content as part of the whole presentation as well. So the first part will be talking about generic concepts of BI and analytics, things that you should know, should be aware of. Then I'll talk about how Data Self has been covering in doing those approaches. I'll do a product presentation. I'll sure enough to cover pros and cons of our approach and then we'll have a Q and A session at the end. I'll also do a few polls throughout the whole webinar. So let's get started. The way I like to talk about BI and analytics is talk about the story of one of our clients. This company is a distribution company here in California. And a few years ago the CEO and the CIO called me. And making long story short, the main part of the conversation was the following. The CEO told me that their company is very data driven. The decision makers, they love and they want to see data facts before they make decisions. And they have several different data sources. They have an ERP system, a CRM system, they have Google Analytics for the website visitors and whatnot, different payroll system, they have social media efforts, they have a lot of Excel files all over the place, access, database and so forth. Now as management, their management asks for, you know, reports, different reports, they want to slice in that reports and new reports. Quite often the decision makers will have to talk with it to describe their needs and wait. And the CEO told me that, you know, they're spending a lot of money on this reporting to get data to decision makers, which is not really the big problem. I mean, it's a big company, they have the money. But he said the biggest challenges that you want to solve is twofold. One is, you know, quite often when they ask for a new report, a modified report, they have to either wait until they get the information or they have to wing it because they can't wait. And he said anyway, waiting or winking, it's getting too expensive for the business. So he wants to solve these two problems. And he asked me, can you help us? The CIO on his hand, the guy responsible for the it, he mentioned that it's been very challenging for his department to keep up with the business requests on the reporting side because his team is really focused on getting all the infrastructure in place and working things. And reporting is something that usually it takes time and it takes a lot of interactions until a report gets exactly the way the decision maker wants. So he's also frustrated and he told me, can you give us a technology that from the IT standpoint, my people can focus more in more efficient tasks than this repetitive and going back and forth procedures with decision makers to get their reports done. So I said, well, before I tell you how, hopefully we can help you, let me go over some concepts that you should be aware of to solve the problem. You should know overall what the problem is, at least putting some names to it. So what I said is typically when someone asks for a new report or a modified report, there are three phases that you have to go through. The first phase is once the decision maker said what they want to see. Someone, usually a technical person, a highly technical person, will have to find the data that will answer that question from the decision maker. In finding the data means you need to know what data source has the data. You need to know the tables, the fields, how to link them. The data preparation is a very complicated phase and typically only highly technical IT people can actually do the data preparation. Once the data has been found and put together, then comes what is called the data preparation phase, which pretty much is, you know, is building a report or a dashboard. It's putting charts, grids, filters showing measures, growth, decline and whatnot. So building the actual report or dashboard is called data presentation. And again, quite often with the tools that typically companies use, Data presentation is also a fairly technical job and also requires experts. Maybe you're using Excel reporting services, crystal whatnot. Those are all tools designed for technical people, not for business people. The last phase is, well, now you need to send the data to people who is asking for. If there's only one person, it's quick and easy. You just email the report to this person and you're done. But quite often you have many people, maybe you have a sales team that you need to send to every salesperson your own reports. Maybe you have divisions and for every division manager you need to send their financials and whatnot. Well, then again it becomes a technical, slow and time consuming process. So these are the three main steps in order to tackle each new report or modified report. Well, if you're using traditional reporting tools, again this process is very time consuming, very slow. There are better ways of doing that, usually more automated, sometimes 100% automated and as this company said, they have several different data sources we call several silos. And one of the ways to tackle really efficiently the data preparation phase is using data warehouse or data warehousing. Data warehousing is pretty much a separate database, sometimes separate databases, but it's a separate database that is dedicated for reporting purposes. And the idea is you can bring any data from any other data source and blend it together in the data warehouse. Of course, as long as you can relate it. But overall, as a business, when you're looking at your business, you have a total business and you want to see the data together. In the data warehouse you can blend the data together, you can put CRM with erp, with Google Analytics data payroll. Anything is just bring the data together, relate it, organize it, optimize it, and then reports will be easy to build and much faster to run. Now a data warehousing, usually it's very technical, it can be time consuming to set it up. But the beauty is once you set it up, once you bring your data sources together, your data silos, it becomes completely automated. Most of the procedures that today people do out there, copy and pasting, massaging the data in places before they put put in a report. Typically with a data warehouse, you can automate Most and usually 100% of those labor intensive processes. It's really efficient, it makes reports easier and faster once you set it up. So that's data warehouse taking care of data preparation. Now for the data presentation and distribution, typically people look for a solid analytics platform that will tackle those two steps very efficiently. Now there are three main features that are really important when selecting your analytics platform. The most important feature is being easy to use. You know, decision makers, many of them, they're not IT people, they're not IT experts, they are running business, managing people, selling, building things. So the reporting tool must be really easy to use, really intuitive, that they can actually access their information anytime, anywhere. They should be able to slice and dice their data, drill down, download and even build new reports from scratch. Empowering decision makers with something that they can do it is critical. They know the business, they know the opportunities, and they should be able to find the answers to their questions without calling someone else. So ease of use is the number one, the most important feature of an analytics platform. The second one is, well, people have different working styles. Some people are sitting on their desktop all the time. Some people are carrying notebooks, different places. Some people use mobile devices, you know, tablets, smartphones, and some people like to receive the reports by email. So the analytics Platform should be able to deliver information, reports, dashboards in an easy way in all of these different devices, you know, desktop, web, mobile devices, and email. So deliver information in different formats is also critical. The last main feature is speed. Who likes to wait computers or phones to crank out information? No one. So be sure that when you're selecting an analytics platform, it will run the reports in seconds regardless of the size of your database. So must be easy to use, deliver information, different formats, anytime, anywhere, and being fast. Now, the CIO asked me, Johnny, I'm not sure if we need a data warehouse. I've heard it's a very complicated, expensive, you know, process. And I said, well, true, maybe not. I mean, we've been doing this for 16 years as a team. In many companies, when they start their analytics in bi, many of them, they don't use data warehouse. True. You know, quite often you can go straight to the analytics and get something done, but in our experience, sooner or later you eventually need a database, a staging database to do data warehousing. So my recommendation is see if you can find a data warehouse that could fit your budget, your timeframe, something that would be quick and easy to get the ball rolling and then you augment it over time. Because I can guarantee you that out there, sometime, maybe in a few months, maybe in a year, maybe in a couple of years, you will need a data warehouse. And if you started building your analytics without the data warehouse and later you have to plug it, it's a mess to rewrite the whole thing and make it work. So to see if a data warehouse can start working for you right now, not down the road. So those are my thoughts. So these are overall the framework that has helped many companies out there to automate most of their reporting procedures and sometimes 100%. Before I jump to the next step, I'm going to open a quick poll here to ask you. So let me launch my poll. The poll is, what are your main reporting challenges? So please check all the ones that apply to your business and be sure to click the submit button at the bottom of the panel. So please choose all the options that apply to your business and be sure to click the submit button. I'm still getting a lot of answers. So wait another 15 seconds. 10 more seconds. Five more seconds. All right, I'm closing the poll. Let me just share it quickly. So we have difficult to use and data silos consolidation is the biggest challenges, which is pretty common. Much appreciated for your feedback. Okay, so I kind of talked a little bit about some generic concepts about BI Analytics. What about Data Self? Well, my core team, we've been working together with analytics and BI for mid sized companies for 16 years now. And I founded Data Self back in 2005 and when Data Self was found. Since then the vision has been quite simple. The tools in the mid market that are for BI analytics, they're usually nice, inexpensive, work well for regular companies. But many companies are more sophisticated and decision makers want easier, faster, anytime, anywhere access to their data. And those tools usually don't cut it. They are clunky, they're slow, they're complicated. But in the Fortune 2000 world you can find great BI tools that are very easy to use and very fast. However, they're typically very expensive and very hard to deploy. So the vision of Data Self has been let's go to the Fortune 2000 world and find BI tools that are really great, that can be simplified for mid sized companies and then bring this Best of the technology without breaking the bank. That's what we do in a nutshell. We bring the best best of the breed technology and we make it work together for you without breaking the bank. And we add additional components to it that simplify significantly the deployment and customization. That's what we do. Best of the breed, make the work for you without breaking the bank. This slide shows Gartner. Gartner is one of the most reputable companies doing technology assessment for Fortune 2000 companies. In every February they released a study that they call Gartner Magic Quadrant for BI analytics. Make a long story short, for the past several years in a row, Tableau and Microsoft have been considered leaders by Gartner, one of the most successful BI technologies out there for several years in a row. And that's what we're bringing to mid size company. Nothing but one of the best technologies. Making simpler, making better. Let me show how we do it. So this is the architecture that I showed before. Data warehouse for data preparation and analytics, for presentation distribution. Well, for data warehousing we use SQL Server, Microsoft SQL Server, which is one of the most reliable and widely used data warehouse platforms out there. However, most companies that use data warehousing with SQL Server, they have to hire programmers to build and maintain it, which is expensive and slow. We have learned that Expensive, slow, we don't want it, we want to make it simpler. So we have built and added our own extraction and transformation and loading tool that pretty much allows people to deploy and maintain the data warehouse in a fairly code free environment. Back to our vision, Simpler, faster, better. On the analytics platform we Use Tableau. And Gartner has rewarded Tableau as the gold standard for analytics platform for the last four years in a row. It's one of the most intuitive, fast and empowering analytics platform available for Fortune 2000 companies out there. Now we've been doing this kind of, you know, enterprise level analytics for 11 years as a business now. And every time we see customers using this kind of technology to build a report that could be valuable for our generic clients, we bring that template to our out of the box solution. So with Data Self, not only you get some of the best technology available out there, but we have more than 5,000 reports, dashboards and KPIs covering all sorts of your needs. You know, AP, AR, GL, inventory purchasing, payables, receivables. I'm sorry, said that. Sales, CRM, information, whatnot. There's a lot of reports as a starting point, so you don't have to start everything from scratch. There's a lot of knowledge in the out of the box solution from Data Self. Now many people ask us, why did you choose Tableau? There's so many other great analytics platforms in the Fortune 2000. Why tableau? Well, this is an interesting story. When we started with Tableau, we weren't so sure how great it was. Until you walk, you don't know because talk is easy. Well, eventually as we learned about the product, we embraced it. We learned that the founders of Tableau, they were actually Stanford University professors and they were studying how business people go through the decision making process. And they hired psychologists and graphic designers to study this process and come up with a procedure that hopefully could help decision makers to go through this data discovery process. And then they hired software engineers. At the end they decided, hey, actually we can make a business out of this, a software business. And then they hired the software engineers to make that vision come to reality. All of the other BI companies that I know, they actually started with some software engineers thinking that they could do better. Tableau instead started from the right angle, looking at the real problem, how to solve it. And then they decided to create a software company. So that's a really interesting story that I think shows how well how successful they are is because their vision is really on the right problem. Let me show how they do it in a way. What should I do? We humans are very visual animals. If we weren't so visual, maybe we haven't survived as a species, but here we are. And if we're in this situation, we don't have to think what to do. We just Jump the hell out of here. Right. What Treadblock tries to do is this quickly give you visual insights into data. Not with snakes, but with data. Let me go to an example. If I show you this table and I ask you how many nines are there here? If you're like most of us, you have to scan the whole table and eventually come up with a number. What Tableau does is usually a subtle but very visual change that will give you the insight in a few seconds. With this change right now, in a few seconds, I can tell there's about 10 nines. So I can shrink the time to get to the inside and have more time to decide and to act on. What about if I look at this table and by the way, absolutely. Tableau and data self, we support rows and columns kind of report. But if I ask you, in this report, you know, you see product type, product markets, profit, sales, which market has the biggest sales or which products are not so profitable. Again, if you're like most of us, you have to scan it and eventually get to the answer. What the blue does is something like this. Bigger bar, bigger sales, so you can see central overall has bigger sales and profitability. Red is bad. So in a few seconds you can tell which ones are not so profitable. Again, shrinking the time to get to the inside. More time to decide and to act on. Now, this is for business. You want to be sure that your dashboard reports are beautiful, but most importantly, they are insightful. You want to be sure the insights are as accurate as possible is for decision making. So let me make the point. Quite often, 3D charts like this 3D pie chart can be deceiving. If I ask you which slice is bigger, the red or the blue? Like most of us, it's hard to tell because it's in 3D. Tableau does not support 3D charts natively because they can be deceiving. Instead, Tableau will easily provide ways to show information in a beautiful format that will be as accurate as possible. So when you have insights, you have accurate insights. In this case, I'm showing a 2D pie chart. Even with the labels, even without the labels, you could tell the red is usually bigger than the blue. Now, the CEO asked me, do you, Johnny, as I went through the presentation, if Tableau is so great, why exactly do I need dataself? It's a good question. Pretty much, if you don't use dataself, what you can do as a company, you can hire people and build all, what I call the pipeline, all the connections from your databases, all the data silos to your tableau system. Maybe you're going to use a data warehouse, maybe not at the beginning. Eventually going to do it and you can do it. Absolutely. There are consulting companies out there that can help you do it. You can hire the right people to help you do it. Probably going to take you months, maybe years, but you can do it. Or you take the shortcut. Why reinvent the wheel? If you have one of our supported systems and we support several ERP and CRM systems out there, most likely we can get you a head start way down the road. Instead of taking, let's say a year and a half, two years to get a lot of your reports and connectors ready, you can get that information much more quickly with a known budget. So what we do is pretty much we shortcut the time and we provide you a solid, well matured and little program involved platform to get started. So that's what we do on a framework Overall. Before I go into the product presentation, I'm going to do a second poll which is what are your main reporting areas. So if you could please check all the options and don't forget to click the submit button. Still getting many answers coming in. Thank you. Don't forget to click the submit button. 10 more seconds. Five more seconds. All right, thank you. Let me just show the results. The results is financials and sales are the top ones, which is pretty common. Thank you very much. All right, let's move forward. Let's go into the product presentation. Thank you for your patience throughout the PowerPoint section. I hope you found it informative. So in the product demo, what I'm going to actually show is pretty much what this distribution company here in California is doing with dataself. Before Dataself, they were spending a lot of time, you know, labor intensive processes. And the CEO told me, you know, I go to these board meetings every month to review what's been done in this month and talk about the future. And today I go with a stack of papers and every board member has that stack of papers with the reports. And quite often, you know, I also have my iPad and quite often board members would, they asked me questions that I don't have answers to. The reports don't cover those answers and I don't remember and it's too time consuming to find the answer in my ERP in CRM. So I just kind of make notes and I'll get back to you. Can you help us? And I said, well, actually we can. The reports and dashboards that you're going to have can be used on different devices like your iPad, tablets, overall, smartphones, and most likely you and your board members that use technology will be able to find answers on the fly. So today he goes to these board meetings with a stack of paper for some board members that want paper, but many of them are using smartphones and whatnot to get to the answers. And what I'm going to do here is I'm going to show three reports that before were very time consuming or they were requiring experts to build. And the CEO built these three reports himself. And I'm going to show some other reports as well. So one of the reports he built himself is a report showing detailed sales this month. Sales by customer, by product, invoice number, invoice date. So I'm going to show how he built that report. Then he needs to see marketing sales trends side by side, you know, website visitors from Google Analytics in how sales are happening on a trend line and see how they're affecting each other. Then they're shipping products all over the US and Canada and he needs to see sales by state and how large the deals are. And then I'm going to show also some other reports. Alrighty, let's switch gears now and show the product. Yay. What I'm showing now is the data self analytics desktop tool. It's powered by tableau. When a person is going to be building a new report or change a report. Well, when building a new report, one of the first decisions is which connector are you going to be working with? In here I have a few simple connectors like revenues, glass, opportunities and whatnot. So I'm going to be making sales reports. So I pick the revenues connector and in data self case, most, sometimes all of these connectors, they have information passing through the data warehouse. The data has been already cleaned, organized. It's nice. It has long descriptive business names. So the data warehouse makes a lot of the data preparation ready. Now, as a decision maker, once I choose a connector and sometimes you can have more than one connector together. Building reports is mostly a drag and drop kind of functionality. If you know how to drag and drop or if you can learn how to drag and drop, you can build a lot of reports yourself. So let me show you how the CEO is doing. The first report is detailed sales. So he wants to see his customer, he comes to the customer list and he drags customer name, drag and drop to the report. So these are all the customers that he has, he wants to see sales. So sale is here. Drag and drop sales into the report. And right now I'm looking at total sales in the whole company history by customer, which. Well, I only want to see sales this month. So the co drag and dropped invoice date to the columns. So that will break down sales by year and it will have as many years as you have in your database. Now I want to go to the month level so I can expand click on the plus signal and expand from year to the quarter level. And I can expand quarter by by clicking the plus signal and go to the month level. So very easy to drill down to different time buckets. And the time bucket that I'm showing is calendar periods. But we can build or one can build these time buckets in any shape or form in the data warehouse. It can be fiscal periods, weeks, whatever it is, days, time, hours and minutes and seconds. And once the time bucket is built properly configured, as a business user, you just have to learn how to expand from the top all the way to the bottom or just drag and drop to see your information in different time buckets. Now in this example I have all my history. I only want to see this month's sales. How can I do it? I just want to see a slice of my data. Well, again, you drag and drop, you get the invoice date and I drag and drop into my filters shelf. And in this example, and then the tool asks me, how do you want to filter this report by From a time bucket standpoint, I'm going to choose relative date and I'm going to say month this month. What happened is now this report will always show this month's sales, whatever the month is. Next month is going to be January. And sometimes, you know, in the board meetings, if a board member would ask what happened last month? Now the CEO in his iPad would click here and choose previous month. And that's the answer. Maybe I want to see the last three months or maybe when I change to quarters, years, you just point and click and you get to the answer again. Even you know, the board members or anyone looking at these reports, once you have the filter set up like this, it's very easy to just pick and choose a different time bucket and get to the answer. So back to this month report. I want to see product, I want to see invoice number, invoice date, how do I go about it? It's all drag and drop. So if I go to product here, I find product. I drag and drop between customer and sales. There it is, by customer, by product, I see my sales. What if I want to See invoice number, invoice date, same thing. Go to find the fields invoice numbers right here. Drag and drop. That's my invoice number. Invoice date right here. Drag and drop, anywhere that you want, just drag and drop. Many of our clients users have learned how to build reports by watching a presentation like this. If you know how to drag and drop, you can do it. Of course many business people are too busy, thank God that they're not going to do it and going to rely on someone else. The beauty is someone else, whoever this person is will be able to build the reports very quickly, very easily and share with other people and make the process a lot more automated. All right, so this is the first report. Now I'm going to create a new report to show sales trends, sales and website visitors together. So I'm going to double click sales and now I have a bar with all my sales in the whole company history. I want to see sales by month. So I'm going to double click invoice date and by default it shows sales by year and I'm going to tell show my invoice date on a month basis instead. And now the report shows me sales as a trend line over the years by month. And I want to show website visitors well before data self. This distribution company would have their IT people, one guy for IT and one for marketing, working together for about a day and a half, copying Excel, massaging the data to build a report to show their sales trends and website visits from Google Analytics. Well, we worked with them and we brought Google Analytics data along with their ERP and CRM data. And now they can easily plot information together by just dragging and dropping. That's what the CEO did. These website visitors which we integrated as part of the revenues connector, we can join with the CRM opportunity, connect whatever it is, we just join the data warehouse. When it's blended you just have to drag and drop. So website visitor is here. It's just part of my revenues connector. I drag and drop into my report. So these are the website visitors when I make a bar. So website visitors are a bar, sales is online and then I want to put them on a dual access approach and there it is. Website visitors are the orange bars, sales is the blue line. And then I can see how my website campaigns were affecting my website visitors and and how eventually that affect my sales trends. So impressive. I mean in this report now is refreshed every day automatically. It's all ready. No more touching, no more massaging. It's Just ready and they can slice and dice it further if they want to. The last report that CEO built shows sales by geography. So you can look at any geography component, customer address, vendor address, account address, account manager address, whatever it is. In this case, he chose customer state. He wants to see invoice sizes and sales. And he has the tool. Show me this on a map. There it is, bigger bubbles, bigger sales, as is shown on this slide here. Let's make the bubbles a little bigger. And then the bubbles are sliced by how large the deals are. And this could be again, invoice size, could be opportunity size. Whatever it is, just plot it and in a few clicks you have it ready. Very impressive. I mean, the CEO was impressed how easily and quickly he was able to build something like this. Now, finally, he wanted to put these three particular reports together in a dashboard. So now he creates a dashboard. And when creating a dashboard, what you have to do is drag and drop. So he took the map, dragged and dropped into the report. He see the trend line, the trend report, he's going to drag at the bottom of the report, and then the detail report, just drag and drop in any quadrant that you want. You control, you do how you want it. Very, very straightforward. Now, these reports, they're all dynamic and in a few more clicks he published this report to their web server. And now when he goes to the board meetings, he and all the board members that have access to the web portal, they can see these reports and they can start interacting with it. Let's say if a board member asks for a question because they don't have this interaction, like, hey, I'm visiting California, Texas, how are you doing over there? In the past, this, you have to make notes and I'll get back to you. Now he can just using his finger on the iPad, he selects the state or the states. And when he does that, the whole report changes to show the results in those particular states. And he export this dashboard on the fly to a PDF file and email to the board member. What's next? Again, shrinking the time that it takes to get the insights so your team have more time to decide and to act on the decisions. So giving power to users, being really easy to use is critical to make this platform or your BI platform to be really empowering. Now what I showed you is the desktop client. Most of the things that I did here using the desktop client can also be done using web browsers and even mobile devices. A lot of things that I did here, you could take a tablet and do it yourself using Your fingers. Now, most people will be consuming information using only web, mobile devices and emails. So let me talk a little bit about that. So when I logged to this portal here, which can be on premises or in the cloud, I will only have access to the reports that I can have access to. So if I'm from the sales team, maybe would only be CRM information and maybe sales. If I'm the finance team, only finance information, some people may have access to everything. So you can control what reports people have by individual or by group of people. Now when you open a report, let me open a report right here. Then the tool can control what data you can see. Like this report here showing top customer by sales change since last year to date, meaning top growth in sales and top declining sales since last year to date. This report, let's say if I'm the VP of sales, it shows my top customers across all territories. If on the other hand, I'm the California rep, this will only show my top customers in California, while the rep in Florida views only the top customers in Florida. So the reports can control the same report. Many people can control what each individual can see. And the same thing applies, let's say, to anything. Like in this case, it's a CRM report, it's a sales funnel. In this report is like a manager report that I can control and see for each account manager how they're doing. And if I'm one of these account managers, when I open this report, it will only show my own. See if I'm Kathy, when I open this report, it only shows me this. And I cannot check the other guys unless of course I have the rights to. But the point is that the tool will control the data that you can see. And let's put some financials here because many people are interested in financials as well. And the tool can also drill down extensively, even if you're not a sophisticated user. Let me give an example. Suppose that I'm the CFO. I have some KPIs here by my locations. When I drill down into one of these locations, let's see Atlanta, the person who builds the dashboard can configure how the user experience will be. So let's say if I click Atlanta here, I could go straight into a drill down report that shows me something more about Atlanta. Or like in my example, when I click Atlanta, you will give me two different drill down possibilities. It could be 3, 4, 5, 10, as many as you want. You control what users will do. And when I choose these drill down capabilities, like I'm doing right now balance details. I go to a could be a completely different report. Still only looking at Atlanta data. Right now I'm looking only financials. Maybe this could be from Daily Report. I could go into Salesforce CRM information for Atlanta. It could be done that way. Yes. Once the data is blended at the data warehouse, you'll be able to navigate, drill down in any direction as long as you know how to set it up. And here you have more, more, more power. So it's very empowering to give different ways to people to consume data, to slice and dice the data anytime, anywhere. Now this is the we call the viewer experience. But if I'm a power user, I can take any of these reports completely, change it completely, slice and dice and build new ones from scratch. If I'm a power user, I can have the edit button. I click the edit button and then let's say I look at this report, I see GL segment 2. Segment 1, I want to see GL segment 3. If I'm a viewer user, I can't, I have to call someone else. But if I'm a power user, I come here and I want to see only this report and I want to put more pieces to it. Here's segment three. I'm going to drag and drop and put it after my segment one, just with my fingers. If I'm using an iPad, there it is. Maybe I want to put actually between two and one. Just drag and drop. If you know how to drag and drop, you can do it. How you save it. Do you have a right to save it or not? There's a lot of security configuration that can control how people access information. Yes, the system is very secured, but I'm not going to save it for now. I'm just going to click and don't save. My final part on the product presentation is as a user, I can decide which reports I'm going to be receiving in my inbox. I can come here and say, hey, I want to receive this report here when I subscribe to it and I want to receive it every Friday 4pm once I click subscribe every 44pm I'll get an email in my inbox with this report refreshed. And if I want to change it, slice and dice it, I can click on it. It goes back to this portal and if I have rights to, I can change it extensively. Data Self also has a way to push reports so the admin person can control groups of people and what reports they're going to be receiving. On a schedule basis in their inbox. So email delivery can be self service, I choose, or can be pushed by the administrators. By the way, you can download the data into Excel, you can download CSV files. There's a lot of way to get data out of this into other applications. Alrighty. I hope you have enjoyed the product presentation. Let me go now and talk about some pros and cons. First of all, data warehousing, what are the causes of data warehousing? So, first of all, it requires skilled people. If you're going to build a data warehouse with your team, be sure to find the right people and be sure to retain them. Because maintaining coding, especially in a data warehouse, can be challenging in the long run, so requires skilled people. In the data warehouse, most data is not real time. It's going to be refreshed on a scheduled basis, maybe overnight, maybe every 15 minutes or every hour. But most data is not real time. It is possible to get real time. It is possible, but usually most of it is not and it requires additional investment. So it's going to cost you some money. Those are the main cons of data warehousing, or the pros. One of the biggest value from a business standpoint is what is called a single version of the truth. Have you been in a meeting in the past where people come with reports and they start discussing and comparing and actually the reports are showing different calculations and sometimes you don't even know you're looking at sales or expenses and actually the way that they are calculated are different and then you're comparing apples to pineapples. Well, with a data warehouse, you define your truth in a single place in the data warehouse. In all reports, we'll derive information out of those single locations. So it's much easier, more reliable to have a single version of the truth. When you go to discuss reports among different team members, you're sure to know that all reports are using the same business rules. So single version, the truth, is one of the most important values of a data warehouse. The second and almost as important, is you get all your data silos into this single database. And now as a business person, it's very easy for you to drag and drop information and have information coming from your CRM, with your financials, with your payroll. Altogether, it's your data. It should be treated as one data, not different silos. So data consolidation is also one of the most incredible benefits of data warehousing. And finally, it will make reports run really fast. It will make reports much easier. So those are the three Main pros of data warehousing. What about Tableau pros and cons? First of all, many people say because Tableau is not embedded into their ERP on CRM system, it's a downside. You know, for some people that might be downside because they want the product to be already inserted. The good news is out of the box, Tableau is not inserted. But with a few usually tweaks and whatnot, it's very easy to add tableau views in your CRM system and your ERP system. You pretty much have to use the web widgets to include tableau reports and dashboards into other applications. Very easy. But natively it doesn't come out of the box. You inside of other ERP CRM systems. Some public visualizations are not built in. If you want to do 3D charts like 3D PY chart, you got to export to Excel or go to the loops and hoops to build in Tableau. So if you want to use some of those potentially deceiving visual techniques, it's easy to export Excel and go that way. Some people consider that a con. I think it's a pro and Tableau, it requires additional investment. It's not a lot very expensive, but there are many other tools that are way more affordable and Tableau actually has a cost to it and it's overall usually worth it. Pros. I think the most important is ease of use data self. We've been using Tableau for five years in a row. We're always looking is there something better? Should we change it to something something better? Well, so far we're extremely happy. There is nothing close to tableau yet out there in the market from an ease of use standpoint. So I consider that the most important benefit of Tableau ease of use for decision makers. Speed reports will run really fast. It focus on beautiful insights. Not flashy, but mostly beautiful insights. And being a standalone product, I actually think it's a major benefit because in most companies, decision makers may not necessarily be using the ERP and CRM system. You want to be sure that your BI covers everyone that needs data. Not only the salespeople, not only the financial, not only one team or all. So not having the tool ingrained in one other product gives the freedom to give any user, even external users, access to it without having to go through other products. So standalone to me is a big, big benefit. Now, should you buy or should you build your own BI solution? If you buy your own, the cons are usually slow. It's going to take a While it's going to be costly, people are usually expensive. And finding and retaining skilled talent is very challenging. And if you find them and you don't retain them, it's even more challenging because new people usually have to rewrite a lot of things. So I think the biggest challenge of building your own BI from scratch is finding and retaining skill talent. Where are the pros? From the beginning, you design the solution specifically around what you're asking for and you have more control. You can use whatever you want to do that. Now, what if you go with a Binance solution like dataself? Cons? Well, initially there's a higher license cost, sometimes not much, sometimes a lot more. So there's definitely more initial license cost and you have less control. Like with Data Self, you have to go with SQL Server. Data warehousing and Tableau, there's some of the best. But hey, you gotta use Tableau and SQL Server, so you don't control some of those decisions. On the other hand, it's usually much faster. You start getting value out of the investment, usually in a much, much shorter time frame. Framework building usually takes months to years. Buying usually takes days, maybe weeks. So faster getting the return, you can completely customize your specific needs, so no problem. One of the things that I'm very proud of as a company, we are thought leaders in this space and have built a lot of best practices. How to build a data warehouse, how to. How to make it scalable and easy to adapt as you change your data sources, how to make things run really fast. It takes a lot of effort and expertise and experience a lot of sweat to get to that point. So best practice is also usually something you get from companies like Dataself that can help you get the job done a lot more quickly. Now, BI deployment approach, you can go public cloud. There are some BI offers out there that use public cloud. And what are the cons for them? The first is can you put your data in someone else's hand if you cannot, well, you cannot go public cloud. If you can, well, that's not a problem. Next cons is control. When you use public cloud, you do control a lot of the decisions they'll make. Upgrades you have to go through, sometimes learning new things at their own pace, not at your own pace. So you lose some control when you go public cloud. And I think as long as actually legal is not a problem, one of the biggest challenges still is uploading speed and reliability. Quite often the Internet will fail and then the data is not there refreshed yet. You Got to wait until the system catches up with uploading data. So Internet reliability is still a major issue making public cloud really reliable. What are the pros? Typically lower initial cost. Sometimes it's very inexpensive from a license standpoint and it's lower in house maintenance of the infrastructure, even though you have to put time into building the solution. But the infrastructure you don't have to maintain because the public cloud will maintain if you do on premises or private cloud analytics. The cons is, you know, typically you're going to have a higher initial cost, more licenses and potentially more servers and whatnot, and also a higher in house maintenance of the infrastructure. So that's usually some of the cons. The pros is control. Sometimes, you know, you feel that your team is not ready yet to get some silly upgrades available. You don't want to retrain people. You want to decide when you do those changes so you have full control. And to me that's quite often a very important benefit still of the on prem private cloud approach. And the second most important one is pretty much, you know, the system will be much more reliable. If you want to give information to decision makers and want to make it reliable and fast. Still usually on prem private cloud is it is a more reliable platform. Usually security considerations, you can go both ways. Some people say public cloud is more secure than on prem. It's a long story, but I could argue in both cases very strongly. And if you want to know those answers, you know, we can have a one on one discussion. Overall if I want to tell you something, you know, as a direction is typically your deployment should be closer to your largest data sources. If your data sources are in the cloud, you go public cloud. If your data sources are on prem or private cloud, most likely this would be the best approach. So this is usually like a major guidance. Where are your largest data sources and your bi should be closer to them. Alrighty, what's next? You can send us your data to do a test drive and it's really impressive when you see your data in data self analytics. We have a year end incentive. So if you have budget and you're looking for bi, be sure to contact me to discuss options and pricing and I can show you the incentives are. I want to make a last poll before I open for Q and A. The last poll is what would you like to do next? So be sure to check all the options and click the submit button. Don't forget to click the submit button. 10 more seconds. 5 more seconds. All right, thank you very much. So let's go to the Q and A. We don't have a lot of time but if you have questions please use the GoToWebinar panel and I'll be checking for questions right now. So we have a question. We have several questions. The first question here from Carl is how long does it take to deploy dataself? Carl, thanks for your question. So for most systems and by the way let me show you here, let me go back to my website dataself.com if you go to the architecture so solutions architecture and by the way these are the products ERP and CRM systems out there that already have out of the box connectors to some of them are more developed than others the out of the box solution but overall to deploy the out of the box solution once we have access to where the solution going to be deployed usually in about two days, two business days we'll get the out of the box deployed. So deploy the out of the box. It's very straightforward. It's like a kick recipe. Two days we get it done. For many businesses the out of the box is all that they need. They just need training take off and they're done. For many of the companies there are adjustments required. Maybe you have many custom things done in your CRM or ERP system that you need the data warehouse in the connectors to be modified. So we can train you on how to do it or you can hire us and we can do it for yourself. So that's pretty much how things work. How long does it take to make customizations? It depends for some people is only a few extra hours and we can do a lot of additional fields and tables. Some people have very elaborate customizations, a lot of tables, new systems that can take days and even weeks. With data self most projects from a labor standpoint is usually a matter of hours. Days rarely goes into several weeks even though we have some large clients that do but rarely goes into weeks of actually manpower. Carl, thanks for your question. I'm going to only address one more question because we're running out of time and I'm looking here, I'm seeing here actually a few questions asking about competition. How do we compare with Power bi sei, some other folks they're all great offers out there. I think just summarize very quickly. The main differentiator that I could tell here is when we chose Tableau Microsoft. Microsoft was already a leader as a data warehouse framework and we actually do real data warehousing just easier and faster. Some of the folks out there, they don't really do real data warehousing, Some kind of simple data repository? Well, if you want to get all your data silos together, you need a real data warehouse framework and we support that in an easier format. So Microsoft has been like a no brainer to choose as a data warehousing platform. When we chose Tableau, Tableau was not yet a Magic Quadrant leader, but right after we chose them they became the easiest to use tool based on Gartner. Again. For the last four years in a row they are considered the gold standard and we haven't seen any other tool getting close to Tableau as far as ease of use, speed, power, reliability. So I'm going to stop at that compared to the other folks. But you know we can have a one on one conversation to discuss in more detail. I have a lot more thoughts around it, but we're running out of time so I really appreciate your time in being part of this webinar. We're going to be sending recording of this webinar later today or tomorrow. If you have questions, comments, please feel free to contact me. You have my cell phone here as well as my email. I hope you have a great Thursday. Have a happy day and thank you very much for attending the webinar.










