Tips - Filtering with DataSelf Analytics (Tableau) - Part I - The Basics
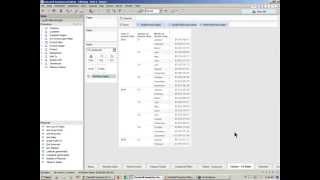
Johnny Girardi walks through filtering basics in Data Self Analytics. Learn point-and-click filters, the filter shelf for dimensions and measures, date ranges including MTD and YTD, wildcards, and top/bottom filters with context.
Questions this video answers
Johnny Girardi (founder and CEO of Data Self).
March 12, 2015.
February 10, 2015.
Chapters
Good morning everyone. This is Johnny Girardi. I'm the founder and CEO of Data Self. Thanks for joining the Data Self Analytics Filtering webinar. Today we're going to be talking about the basics about filtering using Data Self Analytics Desktop, which is the same as Tableau Desktop. The session will focus primarily on the basics in the most popular filtering features such as dates, different kind of date buckets, and regular wildcards conditions, and top and bottom. So let's jump right into the session. So this is the Data Self Analytics Desktop and we're assuming you are already familiar with this tool. So I'm not going to show everything from scratch, mostly focusing on filtering. So first of all, let's show a very simple ways to do filtering. There are two main ways. First of all, let me build a quick query here showing sales by periods. So suppose you're looking at your sales by year, by quarter, by month, or any kind of query. One of the simplest way of filtering your information is just by pointing and selecting only one piece of the information. Let's say if you only want to see, let's say 2013 data, you can put the mouse on that particular 2013 right click and choose Keep Only. So that's one of very kind of intuitive way of filtering something. Click right click on something. Choose View only. Let's say 2014, right click keep Only or you can exclude that particular product from the report. So point and click, right click and choose Keep only or exclude is one of the very popular, very intuitive ways of filtering and that works at any level of your report. It doesn't matter if you're looking at dates, groupings. It could be let's say customer group and then customer or territories product lines. You just point to the level. Let's say I only want to see the first quarter. I point to the first quarter, right click and choose Keep Only. So the report will keep first quarter for everything else. And that applies to any level. If you go to the month level, let's say February and Keep Only. So now you have only February. And if you go to the actual number, right click and choose Keep Only. In this case you will only see that particular line. So I'm going to keep Keep only. You know, for 2013 Q2 April, when I click Keep Only, I selected only that particular line and now I could drill down further into that information. So just point and clicking and selecting Keep Only. It's a very natural, simple way of doing filtering. Now the more elaborate way and very popular is just by dragging and dropping one of your dimensions or measures into the filter shelf. That gives you a lot more options and a lot more control. For instance, if you drag a measure into it, so drag and drop measures into the filter shelf, it will give you a little wizard and you kind of walk through the wizard. So when I see filter by the sum of the sales and then in this case you can choose range of values from the very beginning to the very end, or at least a certain value, no limit going up, or at most a certain value, no limit going down. And then you can also choose special characters. So pretty much you drag and drop dimensions and measures into the filter shelf and then follow the prompts. Well, let's take a look at the most popular ways of doing that. So let me go to the date kind of filtering and I'm going to start showing absolute dates. Filtering by absolute dates. So let's drag the invoice date into my filter shelf. When I do that, I get the wizard for filtering in absolute dates are this segment here you can choose years, quarters, months, days, minutes, seconds and so forth. In this webinar today the focus is on calendar periods. A lot of these concepts also apply to fiscal periods, but that's not the purpose of today's webinar. This we're going to be focusing on calendar periods and the basic techniques around filtering for those time buckets. So let's assume I want to filter by year. So I click here, click next and right there the tool will give me all the available years in my database, which is in this case only three, and I click ok. So so far I'm not filtering, I'm just choosing all of them. Typically, every time you add a filter to the filter shelf, it's highly recommendable that you click and choose Show Quick filter and that will bring some filter card on the right that shows you what you're filtering by your data. Sometimes if you don't have this here, people would not know that you're filtering your report by something and that can be misleading. So adding all of these filter cards is helpful to make the information more standing on your face what is influencing the results of your query. So here for instance, if I uncheck anything, I remove that particular component of the report. So right now I'm filtering by the year 2015 or just 2013. So just selecting different options here will filter the information. Now why is this absolute filtering? Because these are hard coded numbers. If I select 2015 and I save this report as is, doesn't matter. When I open this report could be in 2020 it will still show the report in 2015. It's an absolute date and this applies to any time period. For instance, if I remove this filter and add again a filter, but this time I choose quarter instead of years. So let's check what is going to happen. Click next. Now I see all quarters. Click OK and let me show quick filter. So right now I'm looking all quarters. If I remove quarter four. So quarter four is out of the report. So right now it's only quarter one. This would be like comparing first quarter across different years. So that would be a way to look at this relative date periods. It can be quarter, could be month, could be days, weeks, you name it. So that's how absolute filter works. You just drag whatever date into your filter shelf, you select one of these segments and then you'll get hard coded filtering in your report. Now let's go to relative dates filtering by relative dates, which is actually one of the most popular ways to filter by date. So let's do the same thing. We move invoice date into the filter shelf and now we choose relative date. What is the difference between absolute and relative dates? Well, relative dates will filter your report based based on a time bucket comparing to today's date. So for instance, right now if I choose year in this line of options and I choose this year and I click apply now, this will always show this year. Let me click OK here and add our show. Click filter. So this will always show this year. Or if I choose previous year, this will always be previous year. So if I'm 2016 this would show 2015. This is very helpful because people are often looking at reports this month or last month, this quarter, this year to date, last year to date. So using relative dates is very helpful because it moves along with today's date. And as you can tell, you can choose the kind of time bucket. So if I say the previous quarter in this example is 2014 Q4, if I choose the last three quarters would be current quarter and the last two quarters. So very easy to use, very intuitive once you set it up. If people have if other users have the ability to change filters, they can quickly look at this and see and choose a different option and narrow down the report. Now one thing we like to tell people when you're building reports using filters, especially for dates, well actually for any kind of dimension, be sure to try to make the report informative to what you're looking at. Let's say right now I'm filtering this report by quarter and I'm showing The last three quarters. And if I look at this report, it's pretty obvious what I'm doing. I have three quarters and I see the data right, right here, exactly as it is. But what if I collapse all information and just show year? So this report is showing only information for the last three quarters. So in 2015 is only one quarter, in 2014 is the last two quarters. But if I don't explicitly show this to my users and they don't pay attention, they may get confused. They may be thinking this is 2014 versus 2015 sales, which actually it's not. So usually if you put some kind of indication like this now it's more consistent. You know, it's three quarters and I can't see the three quarters here. So when you're building reports and queries, pay attention to make the report obvious. Whatever you're applying as far as filters that people can see, the filter can see the data and make sense what they're looking at. So that's relative dates, which is very popular. Just going back again, how to build it. You put the invoice date in the filter shelf, you choose relative date and then you can play around with the options of time buckets and pre configured periods of those time buckets. All right, range of dates. Well sometimes what you want to do is actually select from a date, a specific date to another specific date. How can you do that? So far we're looking at buckets like years, quarter months, weeks, so forth. Now I want to select any date from any date. So again you drag invoice date to the filter shelf and now you choose range of dates which is actually part of the same, which is part of this wizard. You can choose range of dates. You can, you can choose start at a given date, no end end at a given date, no beginning or using special fields. So let's choose range of dates. Let me click OK here and put in my show quick filter. And now here I could change by just dragging the dates this way works on both ends or what is more popular is you just click on the beginning, you select the date and then you select the end and select the date. Or you just type in. So you can type in or use this wizard to select the period and that's how you can filter the report. So when you want to select just range of dates again just drag invoice date or whatever date field into the filter shelf, select range of dates, click next and then work with the wizard, which is fairly intuitive. All right. Compound filters. Well compound filters means you can Add several filters together to see how they work with each other. Let's assume I'd like to see sales in February for these three years. Well, I can build a compound filter. First I'm going to add the years to my report. I'm going to add again the same parameter, invoice, date, but this time I'm going to select month. I could select anything, quarters, days, weeks, whatever. So I'm going to select all the months. So now I have two filters playing with each, working together to give the result. Let's say I only want to see February. So there it is. I have sales in February for the past three years. Maybe I don't want to see 2015 because in my sample database today is February 10th in my sample database. So maybe if I want to make a comparison of full months, I would remove 2015 and now I have sales for February, the last two years, 2013, 2014, maybe I'm going to put more months. So compound filters is just. You keep on adding more filters and they work with each other to show you a subset of your data. Now this concept sometimes is also useful when you do to date kind of analysis and when you want to do to data analysis, let's say I want to see this year to date versus last year to date, this quarter to date versus last quarter to date, something like that. Then you can build that filter using compound filters or using also the special to date fields that we have available in the data Self framework. So let's see first how to build using a compound approach. So let me build that segment. I'm going to bring the year level first. And I'm going to show first. Let's show by quarter first. So right now in my sample database today is February 10, 2015. If I want to make a comparison of this quarter versus prior quarters, this is kind of similar as I did it before. So right now I'm comparing all quarters last two years and this quarter. But because 2015 I'm still halfway through my first quarter, maybe this will not be so valuable. So maybe I want to do actually month comparison. So let me change quarter and actually the month instead. I choose months. And then I just want to show January, February and if you want to see the total, I would just collapse. So this is actually a year to date comparison at a month level. So 2013, 2014, I'm showing sales throughout the end of February and in 2015 I don't have full February yet, but it is some kind of, you know, year to date analysis. Some people, they like to do year to date based on the last month. So if you were, let's say in June, you'd be selecting all the way through May. So this would be analysis, you know, through the end of the May on a year to date basis for the past how many years that you want to go back to. So one way to do to data analysis is just adding different filters and making a compound arrangement that will give you what you want. Now the other approach is using the special to date fields. And this approach is actually a lot more precise because it works through today's date. So if Today's date is February 10th, let me actually expand this report to show the day. So we have year, quarter, month and days. And if I go to the very bottom of my report right now, the Last date is February 10, 2015. So if I want to see sales to date, month to date, quarter date, year to date, up to today's date, then we have this special hierarchy which is usually called, you know, something date fields in this case is an invoice date fields that relates to my invoice date. If I expand it, it has this mtd, qtd, YTD which is month to date, quarter to date, year to date. Let me show how they work. Let me drag this month to date my filter shelf, select both and let me put them on my quick filter. So right now if I remove after month to date, let me remove that. What happens is all the segments showing my report, they go through the 10th because today is the 10th. So if I go back all the months, all of them are only looking at sales through the 10th. So now they understand I can collapse the days and I can see for my whole company history here, monthday sales for every single month. So I'm just looking at the first 10 days of the month. So that's how the month day works. Now let me expand this to the day level again, remove the month and choose how the quarter works. Select the quarter date, add this filter and show as a quick filter. So what happens is now, right now to date, I'm actually 41 business days into my quarter. If I remove the after quarter to date from my report, all the prior quarters will only show 41 days into the quarter. So quarter four goes all the way through 41 days and all to the back. If you go all the way back, all the quarters, they have the same thing. So if I collapse all of this report and I look at this, all my quarters in my company history, I'm making a quarter to date comparison. The first 40, I'm not so sure this is 41 days because yes, January, that has 31 days and I have 10 days in February, so there's 41 days in the quarter. So this I'm comparing 41 days, the first 41, 41 days of each quarter in my whole company history. What if I go to the year to date level is the same thing. So let me remove quarter and add year to date. Same thing applies here. So if I remove the after year to date and actually let me remove after year to date, what happens is if I look for every year it goes through until the 41 in this case is the 41 day of the year. It could be the 129 days, whatever it is, but it just counts the same number of days this year and then opens for the years that you have selected in the past. So let me collapse here a little bit. So all years is showing date through February 10th. So this would be a comparison year to the comparison for as long as you want. And again you could apply here another compound filter to select only let's say the last two years or the last three years, whatever it is. So that's how to date fields work. Wildcards. Well, wildcards is if you want to select. Let's say let me put items in my report here and suppose I only want to see items that the name has something in it. So I drag the items description into my filter shelf and I select I want to use all items. Even if I add new items, they're always added into my list of items. I go to wildcard and then I put a name here that contains a name or can start with the name, ends with a name or ends with exactly match. Let's say I want to see Apple and I click ok. So now it only shows items that have Apple in the names. Maybe I'm going to use beans. Just change it and right there I filter by wildcards. So wildcards just recapping, you drag whatever you want to filter could be customer name, salesperson name, territory, whatever. Drag into the filter shelf, select use all, click wildcard, select how do you want to do the wildcard? And then put a name, click OK and usually add to show the quick filter. All right, how about conditions? So conditions is when you want to see something that is bigger, smaller, equal than a certain amount. It's usually related to a value. So if I'm filtering by items, I'm going to add item again to my filter shelf. I select to use all and I click condition and Now I can select by some fields. In this case, I'm showing sales amount. So I'm going to filter by sales and I only want to see amounts that are bigger or equal than let's say 500,000 and click apply, or maybe $1,000,000. Click apply and there it is. So conditions pretty much, you know, you select what dimension you want to filter by, put to the filter shelf, use all, click condition and build the condition. You can actually change the measure. You can do it by something else, you change the types, or you can use a minimum and max and apply to the filter. Top, bottom. Top, bottom is a little bit more sophisticated. Usually when you're building a top bottom type of filter, you got to know what you're doing. It's not too complicated. But if you don't pay attention, you can easily get lost. In the context of building top and bottom, this particular report I have by item, I have sales by year and I have the grand total of total sales throughout all years. So if I want to see my top items, well, this part is easy. I drag item to my filters, I select top and then I can choose top or bottom. So let's see the top three items based on sales, some of all sales. When I click apply, only the three items are going to remain in my report. So there it is. I'm showing the top three. So when you're doing the top among all of your data, this is pretty straightforward. That's all that it takes. You just apply the top and you see them all. Now, typically people are doing top bottom analysis in a subset of the data. Let's say only for this year, only for last year, this quarter. When you go into a slice of your data, then it takes more than this and you have to know what to do because you may get it wrong. I'm going to show quickly what the idea is, even though I highly recommend you to go over this material again or give us a call if you need more help. So let me show here. Let me remove this filter and let me only show relative date in 2000 for this year. So right now this report is only showing me sales in 2015. What if I want to see, say my top products in 2015? Well, theoretically you just drag items to the filter shelf and select the top three, let's say top three items and click ok. So right now I'm seeing the top three. However, unless I do a few extra clicks, these are the top three in my whole company history, not only 2015. So these are my top three in the whole company history. If I want to see only in 2015 or whatever the extra filter that I have, I have to right click on this filter shelf and select Add to Context and for all of them. So right now once I select context for all the filters. Now, yes, these are the top three items based on 2015 or whatever other filter that have applied. So maybe you didn't get it right now, but when you're doing top and bottom, you have to add context and you have to know how the context work. And most likely we're going to be covering this in a little bit more detail in upcoming webinars covering filters. But overall Top and bottom is right is like that. If you want to see across all data, just drag and drop and select top, bottom and that's it. So if it's for all data, this is pretty straightforward. If it's only for a slice of your data, then then you have to use the context. So you got to go to your filter shelves and select Add to Context to apply to only that specific slice of your data. Folks, that was the content that we want to cover today. I'm opening a Q and A session even though we only have a couple of minutes. So if you have questions, Please use the GoToWebinar panel right now to ask questions or feel free to contact me or anyone from our team to give you more details. So let's see if we have any questions coming up here. Questions? Well, looks like we have no questions anyway. If you want to contact us to ask more detailed information, please contact us. Also, this webinar is being recorded and we'll make it available on our website the next day or so and then we'll email you all of you instructions to access it in case you want to review the concept. Thank you for joining us. Have a happy Thursday and see you next time.










