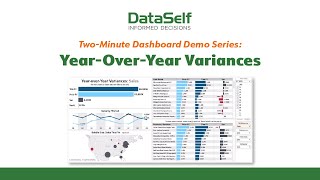
A two-minute walkthrough of DataSelf AI's Year Over Year Variances Dashboard. Watch a manager drill from monthly sales down to individual invoices, zooming into Texas, picking a customer, and finding which products drove the decline.
Chapters
The Year Over Year Variances Dashboard answers questions Are we meeting our revenue goals? Which regions and products are doing better or worse than last year? And what customers do we really need to focus on? Unlike other dashboards, you can interact with datasealth dashboards. This enables managers and analysts to identify outliers those people, products and regions that are performing better or worse than expected. Let's start at the far right. By default, this dashboard looks at the first nine months of the year. Let's select all months, hit apply and the results are updated instantly. Now let's look at our company's performance. The upper left window compares total sales this year to a previous year. Below that is a window that slices that variance by month. The lower left window shows variance by state. Blue circles show growth and red circles indicate decline. Let's zoom in on Texas and note how when we click on this state, the entire dashboard is refreshed. All windows now focus solely on our performance in the Lone Star State. Looking at our Texas clients at the top right, we see that three are growing nicely, but the fourth is just the sort of outlier we're looking for. Their sales have dropped and we need to know why. We'll click on this customer and instantly the entire dashboard changes again to focus entirely on this one client. The bottom right window now lists the products that this customer has purchased from us this year. We can sort those records and then use Data Self's Multi select option to drill down into those products with the greatest decline. The bottom window is now transformed to show transactional detail the invoices that are responsible for this client's declining sales numbers. So if you need to know when significant changes happen in sales, determine who or what is responsible and find out why the year over year variances Dashboard is right for you.