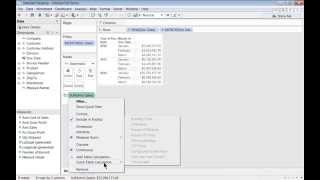
This short DataSelf Analytics (Tableau) tutorial demonstrates how to compute year-over-year (YoY) growth and year-to-date (YTD) totals and growth using Tableau's Quick Table Calculation menu. The speaker shows step-by-step UI actions: choosing YoY Growth to convert a sales measure to percent-growth versus the same period last year; choosing YTD Total to create cumulative month-by-month totals that reset each year; and choosing YTD Growth to compare current YTD against prior-year YTD. The presenter also demonstrates verifying results by dragging the original sales measure back into the view and checking arithmetic (e.g., Feb 2014 ÷ Feb 2013, or summing months).
Chapters
Hi there. This video shows two types of quick table calculations. One is year over year growth and the second year to date comparisons. Year over year growth means how much you have grown since the same period last year. And I'm going to show it right now. As a starting point I have this simple report where I have my years and then I have the first three months of each year and then I have my sales being shown. It could be any measure. In this case it's sales. If I want to convert these sales into year over year growth, what I do is I click on this pill, on this arrow down, and then I choose quick table calculation. There are many options here. In our example, we're going to choose year over year growth and that means how much I grew since last since the same period last year. Those are the numbers. Now I always like to double check to see if the numbers are making sense of what I expected. So let's do that. I'm going to drag the amount sales back to my report. Now I have again amount sales and then the year over year growth as a percentage. And if you do now the calculation dividing, let's say February 2014 by February 2013, you'll see that the growth was 52.99%. So it will be correct. Okay, so that was the first one. Year over year growth. What if I want to see year to date amount? Well, I can then use also quick table calculations. I'm going to take the sales amount without the triangle because the one with the triangle means is a quick table calculation. So I'm taking the original sales amount. Clicking the arrow pointing down. Choose again quick table calculation. In this example, I'm going to choose year to date total. So what happens is this column now is aggregating the sales amount month by month and resetting at the beginning of the next year. And then it aggregates month by month. So this is a year to date amount for sales. Well, what if I want to see year to date growth? Well, what I do is I bring my sales back. So I'm going to drag in this case at the beginning so I'll have my sales. And right now again, you know, if you want to see if it's doing year to date, you can add this up and see if it's matching with this column. And it will. But what I want to do actually is year to date growth since the same year to date period last year. And again we're going to use table calculations. So I'm going to click again the arrow down. Choose quick table calculation. And in this example, year to date growth. And let me put this year's date growth at the very bottom. So you'll have this which relates to the year to date. And if I add back my sales to my report, I can check if all these numbers make sense. So this is the monthly sales. This is the growth since the same period last year on a month to month basis. This is year to date and. And this is growth since last year to date. And that's how you do these two calculations. I hope you have found this video informative. Thank you for watching.