Finding Brave 107: DataStory: How To Explain Data and Inspire Action Through Story, Nancy Duarte
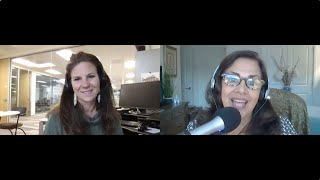
Podcast episode (Finding Brave) featuring Kathy Caprino interviewing Nancy Duarte about her book DataStory and communicating data through story. They discuss Duarte's background in presentations and storytelling, the concept of a data point of view, tailoring data communication for executives, empathy and audience journey, and techniques to make data relatable and actionable.
Chapters
Here we are. Hello everybody. Finding Brave. Welcome to it and I hope you're having a wonderful week. You know, I say this almost every time, but today I so mean it from the bottom of my toes. I'm so honored and thrilled to have our guest, Nancy Duarte here. What an honor. And you are so busy. We're just about to get into the Thanksgiving holiday when we're recording this. I can't thank you enough for taking the time.
Oh, I'm excited to spend time with you. Thanks for having me.
Oh, my pleasure. And I think I always love to tell folks how I first learned of my guest. I think we've connected. I think when I featured you in my Forbes blog, I should have looked that up four years ago or so.
Yeah, yeah, at least that, at least that.
And your body of work blew me away. So here we are four years later talking about your latest book, data Story, which is so fantastic. We're going to get into that. But everybody, let me tell you about Nancy because you're going to fall off your chair like I did when I read this bio. Nancy Duarte is a communication expert who's been featured in Fortune, Time Magazine, Forbes, probably a lot of times in Forbes, Fast Company, Wired, Wall Street Journal, New York Times, Cosmopolitan and cnn. Her firm, Duarte Inc. Is the global leader behind some of the most influential visual messages in business and culture. Yikes. And has created more than a quarter of a million presentations. As a persuasion expert, she cracked the code for effectively incorporating story patterns into business communications and is also a Harvard Business Review contributor. She's written, my God, six best selling books. I'm just writing my second book and I give you so much credit. Six and I Wonder won awards. Duarte Inc. Is the largest design firm in Silicon Valley as well as one of the top women owned businesses in the area. Woohoo. You're on list galore. And you're gonna read all about that in, in the bio that I write up. But I do want to point everybody to your amazing TEDx talk now. Now with more than 2 million views. And this one is the secret sauce to the secret structure. Structure talks. I studied that, studied it and found that just so fascinating.
That's so cool.
Thank you, thank you for all that you do for us.
Thanks for having me.
Oh, pleasure. So we're talking about data story, how to explain and present data and inspire action through story. So before we get into these wonderful questions, Nancy, can you tell me how you got into this work? What happened? That curious.
Yeah. So there's like My body of work is usually about the spoken word. You know, like I, we are kind of spoken word experts here, been around for 31 years, kind of putting the words in the mouths of powerful people. And then I think data has quickly become another whole other language. Right. I mean it is a number, a numeral, number based language. And yet, yet we have all this data and if you can't communicate your findings, you might as well not be communicating, not be collecting the data. And so we have our own, I mean, I was having my own internal frustrations. I'm only 120 people plus like 40 contractors. And we were having our own issues with making decisions rapidly from data. And then I was having my workshop attendees, they were saying, like, we work with numbers all the time, we really want to understand how to communicate our data. And so I just kind of dove in, I looked at we. I have the privilege of working with the highest performing brands and the most powerful executives in the world. And I went in and I pulled all of the slides from our server that had data on them from the top seven performing brands we have. And I just, I looked at what chart did they choose and what language did they wrap it in. And that was the genesis for this book.
Can I understand this? So you looked at your clients presentations that you help them craft.
Yeah.
With your expert presenter.
What's interesting is we did go to what they submitted. So sometimes like they'll submit and then we recraft and reshape. And so I felt like it would be biased, right, if I only used stuff that we had done. So it's, I'd say it's half and a half. Some was what it said when it was brought in and some was what it said when we sent it back. But yeah, I took, I, it was fun. I pulled out all the words off the slides, like, what did they use as adjectives, what did they use as verbs, what did they use as nouns? And just really pulled it all apart. And there's a great couple of sections in the book where we talk about how to choose the right verb. Like after you've gone through the data, you found a problem or you found an opportunity in the data, what verb do you use to get people to take action so your data in the future changes? And so that, that was, that was, I think one of my favorite parts of this whole thing was figuring out that.
Does this only have to be 30 minutes? Oh no, I've got so many questions. And you know, when you talk, when you speak, I didn't Realize in the beginning then you were working on speeches for executives and high level talks. I don't think I've always seen you as a person that's dealing with data, so I didn't really realize that.
Well, I think it's probably because a lot of my work is data. So the research I did for the TED talk, that was like, data. I turned the spoken word into data. And so a lot of my work is analysis. And so it is. So I would say you're right. I've worked with data all my life, but it's been in my books. I portray a lot of the spoken word in a data form. Yeah.
And you know, everything you say resonates. As someone who writes on Forbes and my own blog, the headline, one word in the headline can make it go viral or have it get a thousand views. You know, you're so right. And usually that ver. That word is a verb, you know. Wow. But did I get the answer to. How did you get into this? From school? From high school.
Oh, like early. Early.
Yeah.
It was always a math geek. I, you know, I was in like Mu Alpha Theta math Society and in, in high school. And then when I, when I went into college, I. I took a speech communications course and I got a C minus in it. So I got an F in. I got a A plus in the visual aids. Right. I brought. You didn't have PowerPoint then, so I bought props. I would make posters, so I made an A on the visuals, but I actually got an F in bringing content to the table that was relevant to the students. Right. And that was like a scarlet letter for me. I mean, I was just like, that was like walking around with a big F. Yeah. And I think that failure, that low empathy comes from. It's kind of a long tail. But my low empathy in that situation was because I was actually raised in a home with a narcissist mom. And a narcissist is missing the empathy gene. So I didn't have it modeled for me.
No, I teach and I was a former therapist. Webinar series. I had no idea.
Yeah. So that empathy gene was missing. And especially young girls, they need, they need empathy modeled by their mom when they're forming, you know, in their formative phase. And so I feel like all of my work, slideology, resonate, even the HBR guide, the illuminate and data story, all has a thread of empathy because. So I can, I can, I can hold a model in my mind and I can hold it there and be empathetic. Right. And it's like this gateway for me to be empathetic. And I'm much more empathetic than I've ever been. But that's kind of the genesis for all my body of work. So I answered the genesis for data story. But. Yeah, well, if you must know then what I've gone through and I know. Yeah.
I have a whole section in my upcoming book about what narcissist narcissism does to us as we. For you that you overcame it.
Thank goodness for the. Not everyone does. I know. It whacked me and then it just made me super committed to. Yeah, I dropped out. Dropped out of college too. After a year. I was so discouraged.
Did you go back or you didn't need to.
You know what's interesting?
I did.
I. We popped down into the Bay Area, built the business for 20 years. Super successful business. And then Cisco, my customer, they put in a diverse supplier program, which is they try to help some of the diverse suppliers. They paid for me to get my MBA from UCLA. So because they represented me to UCLA, because of my 20 years of business success, they let me skipped my undergrad and I went straight into the MBA program. So I have a high school degree and an mba.
Wow.
But nothing in between.
Perfectly right. That's so lovely. All right, now let's get to the heart of this. And this is for anyone who basically presents anything to decision makers, to anyone that we're wanting to inspire some action from, whether it's. I was just mentioning, you know, the podcast episode I did where I reached 100 episodes. I presented some data. We're not just talking when we're presenting data, we're wanting some action or some decision. So what do we need to understand when what is communicating to decision makers look like in a way that's different from our normal conversation or the.
If the decision maker is an executive. I think there's a whole section in the book about communicating to executives. And I don't know if any other executive's ever written a chapter on communicating to executives. It's kind of like that movie Inception, I guess. But I spent a lot of time thinking about when. Where have I been frustrated when people communicated data to me. Why did I not know how to make a decision or why did I make the wrong decision? And so I thought through how I measure my own team and how I've been measured. And there's three ways that executives are measured, and that's money, market, or exposure. That's it. So if you're writing A recommendation. You're trying to get action taken from data. If it doesn't hit a nerve on money market or exposure, the execs not going to think it's worth their time. It's not even worthy really to be on their, on their desk. So with money, an executive drives up revenue and profit drives down cost with market, they try to drive up market share and they drive down time to market with exposure, they're driving up retention. Clients, employees, partners, they're driving the retention up and they're driving the risk down. That's it. So if you go through data, you find a problem and opportunity that deals with any of those things, it should be on the table of an executive. And how you frame it inside of this framework is going to help them see it. Like for me, I was struggling to even just see. Like I would be with an employee at the Coffee Pot and I would thinking they're just telling me color about their day and they're trying to get me to like make a decision. And so the nomenclature, there was a gap between when I thought they were asking for a decision versus they were just venting or they were just, you know. And so that's what, that's what a piece of this book is. Because if you're digging through data, you either found a problem or an opportunity and suddenly you're done looking at the data. Now you need to use communication to solve the problem or the opportunity. And that's a communication problem. And so how and who you communicate with is just really critical at that point in time. And a lot of people don't know how to communicate up. They don't know, they don't know a framework, they don't know the empathy. They don't understand what keeps an executive up at night. And there's a whole section about that on, on what keeps exactly what's on their mind all the time and how they're measured.
Just give an example of this and get your feedback.
Yeah.
One of the things that literally drove me out of corporate life, I was in a book club, big book club company for 11 years and another book club company bought us. And I did market research. I love data. And when customers said they don't like the negative option book club model where you just automatically send a book every month and they would have to return it and no one would return it, well, that's how our company made millions. Well, research, you know, focus group after focus group said I hate this. And so as the researcher, I said I made the mistake of presenting this as and I went to the President and the CFO and you know I have heard this now 100 straight times. Is there a way we could explore what the cost would be to do away with negative option and whatever. What holy one woman said to me that was the nail in your coffin. And I was like, I didn't even know I was in a coffin. But I think of what you're saying because while I had the data, the data wasn't fully baked enough in terms of the cost. I mean they. It imploded 10 years later. I was like 10 years ahead of my time.
You were early probably right.
You saw send an email to five of the top people with a half baked data story.
Right.
Would you agree with that? Exactly. What wrong.
What's perfect about what you're talking about is a data story has a three act structure. The first one is you say you set the scene like this is the situation. The middle is what you had. You had your messy middle. This data is bad and we need to turn it around. Right. This is the data that I'm concerned about. We need to change the trajectory of this data. And then the third act is where you're supposed to propose a solution, therefore we need to blah. Now you might have said therefore we need to stop the program but nobody's going to. So it could have been there for while we are decreasing while, while the revenue in this model decreases because they're not happy with it. We need to invent a new model. And then if you had them crisscross and say let's have, let's have carve out two people to be our innovation team and think about and research models in the future and where things are headed then maybe, but you know you're.
Making me feel better. You're healing 20 years of pain. They didn't want that message any way I delivered it.
Yeah, they, they didn't want that message.
Shut up. You're not on board. So now I. You've healed me. Thank you so much. I appreciate it. Now can you let me just understand you what you talk about in your 2 million TED talk. Do you think that that structure of a great talk, Martin Luther King Lincoln, does that still apply to the data story?
You know it does what the. The data storybook itself is broken up into four chapters. The first three chapters are identifying the problem, make a recommendation so it creates an initiative. You could call it that. The fourth chapter is wow, you're so bright with data. Now you're getting invited to be on a stage. Whether it's an industry stage, an all hands meeting stage. People are wanting to hear from you as a communicator. So the entire chapter four gets into crafting it so that you can verbally unveil it over time. And there's all kinds. I lifted some ideas from a couple of TED talks too. And what's funny is I've been a student of Steve Jobs, right. I've transcribed every talk he's ever given. And when I would analyze them for content, I would be like, oh, that's content. Content. Oh, that's data. I'm going to skip over it. Oh, content, content, content. Oh, data. I'm going to skip over it. There's no content. Like I used to think. Oh, it's just data. There's a finite way to present data. And so when I was done with the whole book, I was done with the data story concept. I was done with the made to stick section, which is kind of what you're make data stick. I went to the transcripts that I keep right here in a drawer and I went to, and I highlighted everywhere he talked about data to see if my research was true. Because if it applies to Steve Jobs, it's true almost right there.
Research about how to tell a compelling story and get action. Yeah.
And so there's all kinds of other insights in the book around how you frame a moment. So the Resonate book is about the gap between what is and what could be as a structural device for the spoken word. What happens is you use data as a small atomic bit in this longer form. Right. And so the way you frame that small atomic byte in a bigger narrative, there's some real magic there. And that's what the make data stick section is in here. Yeah, it was fun.
I'm poring over every word. I mean, every presentation I give is breakthrough. And you know, you need every aspect of communication to do that. Data, emotion, empathy. Wow.
Yeah. This is fun. I loved, I loved writing this book.
Now help us. Anybody listening who wants to present data to make an impact of some sort. How do you craft, as you call it, right. The data point of view. How do you do that?
Yeah, I think there's a real career threshold someone crosses. So people who work in data all day, they're exploring it, they find things, they synthesize it and they might see a problem. But a lot of people aren't comfortable forming a data point of view of view about data would be when you take the time to articulate the action. Right. And whether it's, whether they don't like the action or not is another thing. But you are seeing what is the action we need to take. So our future data is different. And that's the big thing about a point of view. You know, kind of like your example. Oh, my God. The data is telling me we have a problem coming. Right? They just didn't believe you. Now, maybe if you shaped it slightly differently, that would have been more palatable. But I think you were hitting a nerve so deep, they never would have, you know, they never would have maybe bought off on it. But I mean, part of what taking a point of view about the data is, is your point of view will always have a verb. So it's like, oh, I saw this in the data. Therefore, we need to what? And that's how, you know your point of view should answer, therefore, we need to what? And that's like, here's my point of view. Here's what's at stake if we do or do not do this action. And that's how you craft a point of view about the data. So it's like a formula which I think analytical enjoy. Like, if you take some of the creative nuance out of it, there's an actual formula that can craft for you an executive summary around your data of which the point of view is a part of it.
So when you. I have so many questions. What did you say that made me want to ask?
I was talking about the data point of view.
So is this. Is this another way to say it when you present. You have to. And the more you can sit in their shoes about what they're worried about, Right. The more whatever you say is going to be received. But the data point of view. Tell me that again. Tell us that again. It has to have.
It has to have. What is your point of view meaning, therefore, we need to go do this activity. And then what's at stake if people do or do not do that activity? So you've moved into, wow, there's this big finding in the data. So now we need to go do this. Now. Now, having empathy for the people who have to do it is also a big part of it. But your point of view is, whoa, I think we need to take this action. This is what's gonna happen if we do it. This is what's gonna happen if we don't. And that is your point of view.
Wonderful. And, you know, this is what I wanted to hit on. You said we. The ultimate outcome is that we want to change this data.
I mean, the future data.
So that takes it away from being personal. It takes it away from like this situation. Hey, look, we're going to lose money in 10 years. You don't think it's a problem? But this data is showing it. We need to change the data. The future data almost impersonalizes it. Is that what you're trying to get at?
It does quite a bit. And whatever the activity, so many people forget. I mean, we look at data, I mean, it sounds like you used to analyze data day. We're just analyzing, analyzing. And people forget, like we're just kind of numb to the fact that humans pretty much generated all of the data. Like pretty much. You know, if you personify a cancer cell or whatever, that's also human in its nature and its activities. Right. But I mean, most of the data we track, we're tracking what a human sent. How many clicks did they do? How much did they buy? What, what is their favorite of that? Like, we're tracking human things. So it is human activity and behavior that will change the trajectory of the data in the future. And so that the super important part because sometimes we just, we get so sucked into the numbers and we're so excited by the numbers and, and what they say and what they mean that we forget that humans actually generated those numbers sometimes. And you are smart to have conversations or read the comments and you know, that's, that's the job of a good researcher.
Wow. And you know, I think what you're saying if I push it further is if I'm going to get up and present the marketing data is pretty bad. We're losing our shirts. Anyone who's sitting in the audience who had anything to do with the result that you has just been attacked.
Yeah, right. So that's why you have to have the answer to that. Like you can create suspense how you deliver it, but it's like, look, this data is headed the wrong way. So therefore now we all need to go do this new activity so we turn the data around.
Can I ask you this? It's not a strict data question or data presentation. When I was doing market research, I was charged with researching another department's product development efforts. And the woman in charge who passed away now had a fit. I mean, she was like, I want to get rid of Kathy. What do you say about when a person who's presenting data is actually not in charge of the initiatives? Like, what I learned is half bake it and bake it up with her. In other words, I don't ever present without her seeing it, without her being able to shape it. Would you agree? What?
Yeah, I agree with that. And one of the things I love about some of the Google products and where the office products have gone is now you can go and co create documents and co create presentations together, even if you're in two different states or whatever. And so it's becoming very cool. But collaboration, especially when it's between silos or between departments, that's a recipe for disaster if you don't have empathy. Right? So that was kind of getting up and that was getting up and presenting something without having walked in her shoes first. And there's a, there's a lesser known component of storytelling where the protagonist will put on the skin of sometimes their enemy or put on the skin of the very people they're in, in a battle with Avatar. Very clear, right. He put on blue and suddenly he's like, this isn't our enemy. Right. And so it's this moment where you put on the skin of someone from another department, walk in the shoes of someone from another department before you just walk into a room and present the content. So that's an empathy. That's an exercise in empathy.
I love this. Can you tell me something? You know, you talk about Steve Jobs, his Stanford commencement speech. I can't get enough. Are some people just naturally gifted orders and they never thought for a second how to, how to, you know, streamline a talk.
You know, Steve, Steve Jobs worked for anywhere from six weeks to 12 weeks on his talks. So for his big ones, where millions and millions of people, he would be served up to 2,000 slides, one to 2,000 slides. He would pick, he'd make him pixel perfect. He would, he would rehearse, rehearse. He knew what he wanted to say. I mean, I struggle to believe. I mean, he didn't. There's no way he stood up and did that speech. He had notes in front of him, you can see him referencing them. So he planned. Now, he may be faster at it, but that's only from years when he actually, there's some old footage of him, some kind of cutting room floor from some interview he did when he was just a wee pop, like a little guy, you know, young.
Was he great then?
No, he was not. He was nervous. He was, he was, I mean, and wasn't super articulate, you know, I mean, it's, it's. And he was, you know, kind of airy, you know, just arrogant and all that stuff. And no, I mean, I, he worked hard on. And there's a big gap, right? I mean, he was a really great communicator. And it's really. People ask me, like, who's the number one? Like, maybe I ask you, who's the number one business communicator today? Who? People ask me that all the time. Those shoes aren't filled. It could be. We should. There should be some female, some male that should be just as amazing of a communicator. And there's a gap. Gap. There's a gap. So I'm hoping.
Nancy.
I don't know. Right. But there's a big void there that can be filled. I think, you know, people are working on it.
I mean, part of that is charisma. Part of that is.
Part of it is energy.
Wow. Whatever you've got going on, I'm gonna listen. Yeah, we have a lot of that.
In our seniorship, especially not in political.
Oh, Lord. There's another.
Lordy, Lordy. We're not gonna go there.
No, we're not. All right, now what is we not. Oh, two things. How do we make data stick? And have we talked about the human a little bit?
You know, we talked about that. It can, but I didn't really talk about how. And there's three things you can do to make it stick. And one of them is to tie data to another relatable object. So when you. When I've heard people say, wow, that. That's as much money as if I were to stack the dollar bills, I could go to the moon and back and around it six times. Well, how far is the. I've not been to the moon. Have you been to the moon? No, it's 269,000 miles. How far is 269,000 miles? Like, the scale of that number. And so if you. If you. If you take numbers and make them relatable, like, you would need to drive for four weeks at 65 miles an hour to get to the moon. Well, that's a little more 24 hours a day. Right. You can understand that because, you know distance and you know speed or, you know. Right. And so you have to connect it to something relatable for people to get the scale of the number and attaching it that way. And another thing is to talk about the humans in the number, like, who is the person doing the struggle? And can you show a picture of them? Can you talk about a day in a life of this person who is creating this data and make them relatable? And then the other thing is using time. Like, you can actually show data over time. So it's interesting. You Were talking about, wow, the numbers are going to crash, right? And I think you said, what if marketing has a bad number and it's just headed down? But you can tell charts over time to where the number's going down. But right here we can change the data and we can make it go up. If you show that over time, you can create the dramatic rise and fall of a story. So you can create suspense and surprise just in showing a chart, just how you chose to break it over time and show it sequentially. So there's things like that that can get a gasp out of the audience. Instead of throwing all the data up there at once, you can actually get a gasp is a physical emotional reaction to data. So you can create suspense and surprise. It's just, it's just loaded with like, with ways to make it stick like that.
Can I ask you to dumb it down for us in that? Okay, what am I trying to say, you know, when I give talks? And now I'm talking about the seven damaging power gaps. Professional women facing how we close them. And I presented it live for the first time in September with a few men in the audience, but mostly women. And it was the first time I said in front of people, I've done a survey now on its type form, so easy, 98% of all respondents have at least one of these gaps and over 75% have three or more. And there was a gasp.
Yeah, I love that.
So what I do want to say to people is it's not difficult anymore to get data, but can you. I mean, I did it on Typeform, nice little easy survey that was, you know, immediately showed me the data and I could download it and then cross tab it and filters. But can you give us some? For somebody who is hearing you and saying, I know I need to talk about data, but I don't. I'm so uncomfortable with how to do it, where to get the. What platforms. Do you have suggestions about easily accessible platforms?
That's a good question. I want to make a comment too, if you don't mind, on what you just said, because I thought it was interesting. If you had started your presentation and said 91% have these power gaps and then you revealed the data, I bet you didn't do it that way. I bet you were going through the power gaps and they're like, ooh, I don't want to be that. Ooh, I might have that right. They're processing and then you said 91% and then they're like, so the order in which you did it. So a lot of people when they're presenting data, they, they are so excited about the 91% they didn't, they didn't build over time all this underlying narrative and underlying data to where, when they, when they pop that 91% out there, it becomes a shocking statistic, we call it. And that's what you did. So that was, that was good, but it was because you did it in a certain order, you kind of flip the order for data. If anyone in your audience is a data nerd, there's massive amounts of tools out there, Tableau, Excel and just lots of. There's even a programming language called R that you make data in. But even day to day, like just, I mean, I think everyone uses Excel or even tables and PowerPoint or charts. And it's everywhere. It is everywhere. Like, even my creative director, she's worked for me for 25 years now. Creative director does the most beautiful, you know, art directed the book. I mean, she's just beautiful. And she's like Nancy. I'm just fatigue. Data is every like her job, about 20% of her job now. She's digging in data, optimizing the team. And it's just like, ah. So everyone, they say Right now, today 67% of jobs are impacted by data. And that number's only going up. It's only going up. And so everybody's job now involves data and how it's generated or how it's visualized is almost, you know, doesn't matter. It's just trivial. It's just that the data is there. If you can't communicate it, it's worthless though.
Do you feel people need to be good with numbers to be good with data?
No, I would say, I would say just like kind of to your question about, are people natural communicators? I think people are natural with numbers and I think some are not natural. I think that if you're not natural with numbers, you can learn it. Just like if you think you have no charisma, you don't have stage present, you can learn it. So I think it's, it's true. So someone charismatic might not have numbers. Someone who has numbers might not have charisma. But they're learned. They could be learned, right?
Gosh, I love it. I love it. Now, what do we not know here? What, what have we not talked about that we would be remiss here other than my grandkids?
Let me think.
You're amazing. Turkey, brine, turkey.
Oh, yeah. I don't know. I don't know, I. I just.
The biggest thing that when you talk to a person who doesn't know what you do, and they're, you know, working at an organization, important organization, and they're about to present data, what is the biggest, worst mistake they're making?
No empathy. Low empathy. Not having considered the fact that. I think it happens a lot with people that are in engineering or science backgrounds. They come at it and they'll just. Whatever is the normal. Like let's say you're a cancer researcher, right? What? You're using charts and scales of things that most people don't understand. Right. And they forget that in their own industry this is normal. But now I'm going to go to a big stage or I'm about to present to a broad audience. Like if a cancer researcher, they can present to their peers differently. But if they're going to go into a room with breast cancer survivors, you better not be. They won't understand all your logarithmic charts and your scientific data. So I think it's empathy. It's really. It goes all back to empathy. Know who you're talking to. Know how they process information and really think through what you're asking of them and how they're gonna feel about it. How are they gonna feel when I tell them that they need to behave this way or believe this thing or start, you know, caring about something they didn't care about? And you gotta map that out. We call it an audience journey. Who are they when they walked in the room, and who do I want them to be when they leave the room? And you have to articulate that. We call it a move from. Move to. We do that on every project we do from everyone. Everyone. All of my service business, my training business. It's like, here's who they are when they walk in the room, and here's who I want them to be when they leave the room. Everything you build in your talk should feed into that transformation of the audience.
Oh, breakthrough. Can I give a palpable of how I blew that? And so people can understand that.
Yeah.
So my world is people coming to me who aren't happy with their careers. So if they're comfortable in that discomfort and. And when I share that, that was me. All is good with this seven power gaps thing, which was new for me to present. One woman stood up and one of the gaps is acquiescing instead of saying stop to mistreatment. And she stood up and, you know, in front of 250 people, that's a big thing. To stand up and say, I have to be honest. I've never been in a job that I haven't been sexually harassed. And the whole audience gasps. And she said, is it your opinion that it is so prevalent that we need to grin and bear it? And I was so focused on my message that I didn't have this. I didn't have the empathy. I didn't have the audience journey in mind. And I said to her, you know, what's your name? Sarah. Sarah. No. I'm so sorry that you've been through this. It breaks my heart, but, no, it is not my view that we grin and bear it. Grin is smiling. Grin is saying it's okay. Bearing it is tolerating it. But I can be so forceful.
I'm like that. I'm forceful.
She wrote me later and said, wow. I don't.
She was hurt.
I don't think you. You were ready for my question, because I think what she meant was, you came at me hard.
Oh, wow.
And I don't think other people say, felt that. But I can be so into the message that I forget the impact of the person who's brave enough to stand.
There and say, you live and breathe your work. It's based in research. Right. And so for you, you come from a place of such great conviction. So probably the gap between your conviction about the truth of it and her not ever being able to take the stance that you're saying. Right? Yeah.
So I lost the empathy. I lost it. I lost the. And you can lose an audience.
Well, what do you wish you'd done differently?
Oh, like, what? Could you have just softened it? I could have said, I so hear you. I've experienced it. I think probably who in the room is normalized it? That's a therapeutic term, right? Normalized it. You are not alone. But let me share my view. After all of this work that I've done.
Yeah, but I like you, probably. I get so fired up in the moment. Your heart's beating.
Right.
You're pumping, you're fired up. You're trying to hold a stage and hold a 10. It's hard to.
I regret it. I regret it. And empathy is the answer. Take a breath. All right. What? Anything else to leave everyone with? Did we get to how to make data stick? Did we get to that? We covered it all. You know what? I so recommend everybody get this book Data Story, but also watch your TED Talk, because I think they're a perfect complement.
They are. Yeah.
Because there is an arc, as you said. If I had presented the numbers, okay, 98%. And people be like, big whoops. It's that you let them down. A journey where there was empathy and they could relate first.
Exactly.
So watch this. Amazing. And where does everyone learn about you, Nancy? Where do they get the book? How do they take all your amazing tools? And.
We'Re@Duarte.Com d u a r t e dot com. I'm on Twitter. Nancy Duarte. Twitter, Duarte. Facebook. I'm Pretty active on LinkedIn. Very active on LinkedIn. So I do connect to everyone who connects to me on LinkedIn. And then, yeah, I'm, I'm up there. Just Google it. Probably find something of interest there.
And the book, Amazon, wherever.
Amazon, Barnes and Noble, it's in all the airports. I think it'll should be in all the airports through, like March. It's so fun. Oh, my gosh. We. So my employees, you know, they're. They're travel all around the world all the time, so they're sending pictures in. It's been fun. Yeah. Book's doing well. It's hitting a nerve.
I'm so happy for you. You are, really, from a career perspective, you are, you know, you're. You dug deep, discovered your right work and illuminated the world with it. That's what I think you've done. And that's so sweet. So inspiring. Nancy, thank you for being here. Come back again with your next book. Number seven. Right.
Darn it.
Congratulations.
Thank you.
I hope you're so inspired. If you don't have questions, we're not doing our job. Ask us questions. Connect with Nancy on LinkedIn. Ask your question. I'm going to post this wherever I am. All the social media, ask your questions. I'm sure we've cracked open something for you that you don't quite understand. We'd love to hear from you. And I'm guessing Nancy might have the time to answer a question or two.
Maybe I do.
Wonderful. Thank you again, everybody. Have a wonderful brave week. We so appreciate you being here. See you next time. Bye, Nancy.
Bye. Bye.
More from Kathy
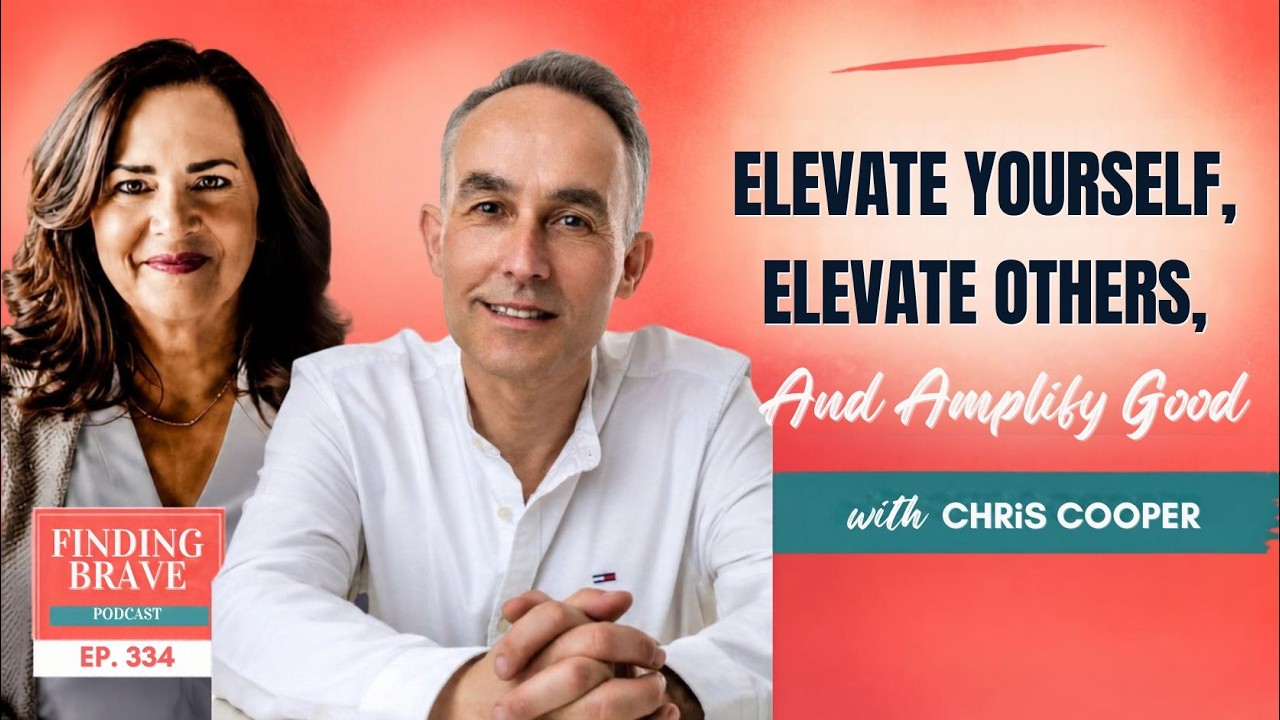
Elevate Yourself, Elevate Others, and Amplify Good | Chris Cooper | Finding Brave Ep. 334

Finding Brave Epis #333: How Leaders Can Harness AI Without Losing Their Humanity, w/Bennett Borden
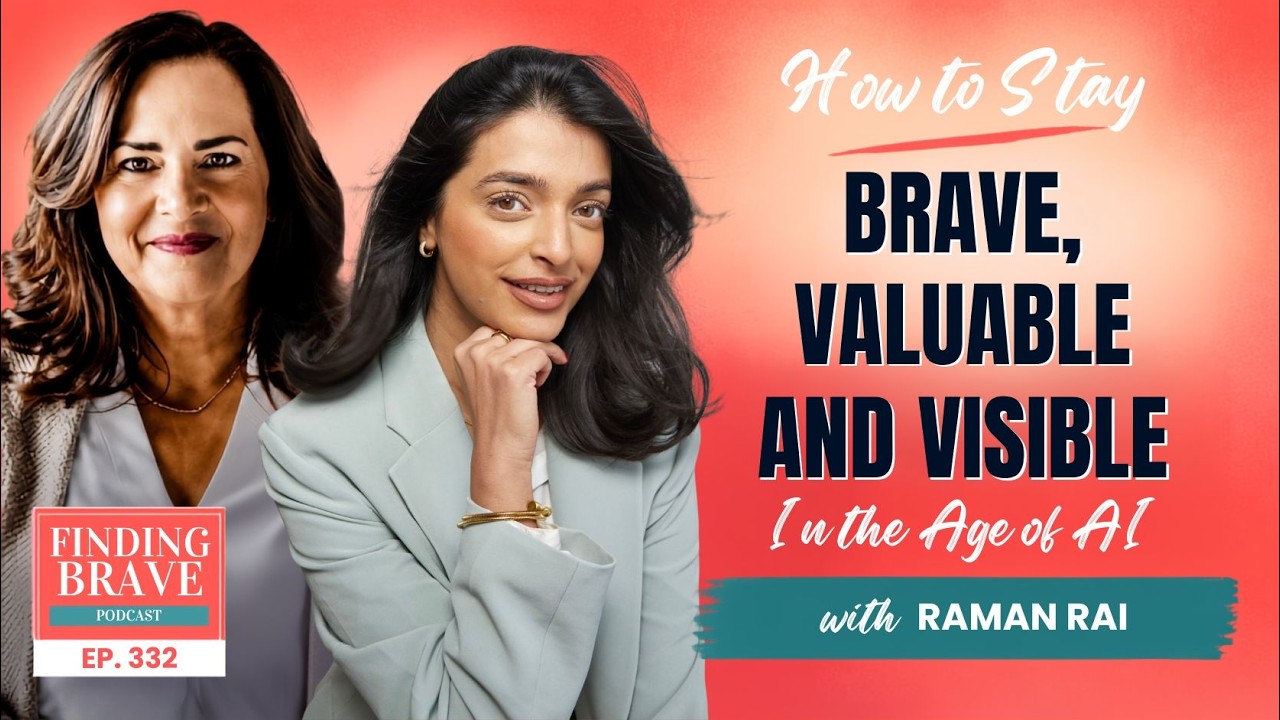
Finding Brave Epis 332- How to Stay Brave, Valuable and Visible in the Age of AI, with Raman Rai
Finding Brave Epis 331 - The Power of Positive Disruption, with Dr. Patrick Leddin
Finding Brave Epis 330 - Being 40: Letting Go and Embracing Who You Are, with Stacey Lindsay
Disrupt Career Reinvention with Kathy Caprino - via The Disruption Lab Podcast w/Patrick Leddin
Creating Neurodiversity-Friendly Work Cultures: Simple Workplace Adjustments Matter
Finding Brave Epis 329 - How To Create a Neurodiversity-Friendly Workplace, with Kristen Pressner
Finding Brave Epis. 328: Reclaiming the Power to Trust Your Own Voice, with Dr. Cindy McGovern