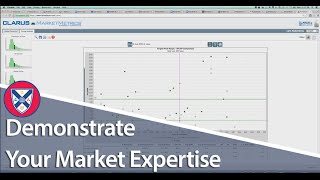
A real-estate agent explains how to handle sellers who want to overprice their homes. Using Claris Market Metrics data, he shows that correctly priced homes sell in 33 days with minimal reductions, while overpriced homes take three times longer and drop 7% below asking. About half of overpriced listings never sell.
Questions this video answers
January 21, 2015
Listed at $424,000 and sold for $417,000 (1.6% below list) in 33 days with no price reductions.
Example overpriced listing ~ $450,000; sold about 7% below original asking price, took roughly three times longer to sell, and required an average of two price reductions.
About 50% of properties listed did not make it onto the chart (did not sell during their listing period).
The higher-performing batch averaged $126 per sq ft; the other batch averaged $111 per sq ft.
Greg says, what are the best resources for being a market expert? We use two resources. So we use Keeping Current Matters, which my agents really like. Steve Harney, it's once a month and he's got a bunch of different tools and stuff. They actually have a blog as well. And then we use Claris Market Metrics. Market metrics. So on listing appointments. And we use. Yeah, Claris Market Metrics. I heard that it's. This is pretty cheap. This is the one where there's pricing and market analysis. You can get very specific. Highly recommend that in some markets it's not available. This is a game changer. Yeah. So, okay, so let me go to pricing analysis. I'll show you the one slide that will. It's a game changer for getting property priced properly. So you can go zip code. We'll go to 287 7. It's gonna pop up here. There you go. And we're looking at, let's call it 400. We just pick this range based on what they think the home's worth and what we think it's worth. So they think it's worth 450. We know it's worth 400. So we bracket that and then we just do a search. And then there's one chart in here in particular which is just. It usually tells exactly the story that you need to tell. So when I was giving listings, and this is with regard to pricing. So there's two. Our process is we prep for the appointment, do all that stuff, sell our interview, all that ahead of time. Put pre list packets, goes out. Listing engine gets to the door. They do the walkthrough, they build rapport is the only reason to do the walkthrough. We don't pick on the property. We sit down and then we get into market. Into the market, show them that we're the expert. There's a series of other slides. There's market dynamics and pricing analysis. You talk about inventory and absorption and all that good stuff. But this one is one that you'll come back to over and over again and basically say this. This tells the story exactly the way you want it to. Almost. I couldn't have scripted it better. I didn't do this on purpose, obviously, but. Okay, Mr. Seller, so let me kind of go through this. So there's three outcomes here. You could be a filled in dot. So those are. No, you could be a dot that's not filled in. You know, someone that's listed their home for sale, they sold it without requiring a price reduction. Then you could be a filled in dot. So they still sold their home, but they had to have a price reduction or you can not be a dot at all on here. And there's a full 50% of properties that are listed that don't make it on this chart in terms of selling during their listing period. So let's look at the data here. So for sellers that price their property correctly, they were on the market, they priced their property at 424, they sold for 417, 1.6% off of their original asking price in 33 days with no price reductions for those that missed the price out of the gate. So they cheated on the high side. They priced their home almost at 450, so $25,000 higher. They sold it for almost exactly the same amount, but 7% off the original asking price. It took them three times as long to sell and they had two price reductions on average. So off script here. The good thing about that is saying so we can choose one of two paths. So we want to have a successful outcome. If we don't get the interest we need, if we don't get the showings, we have to respond. We have to get our price changed on average. We know if we miss it out of the gate and we don't get an offer close to our asking price, we've got to on average reduce it two times to get it sold or not even be a dot on this chart, which is not the outcome that we want. Either way, you're going to get the same price. You get the same price for the property. And they just started adding this. And sometimes it works out, sometimes it doesn't. This data shows that they actually got less for the properties that sold. It just turns out that this batch of 23 homes here were bigger and they sold for less. So on average, they sold for 111 bucks per square foot, versus the first batch, it's 126. So this is a powerful chart. If you can get Claris Metrics in your market, you've got to get it. And it's got a bunch of other charts, but this one is the one that you're going to keep in front of you as you're pricing their home and as they're making that shitty decision to overprice their home to price it at 450. You know, the numbers don't always work out where you can actually use these numbers, but sometimes they do. And you could say, okay, you know, I'm not going to lose this listing over price. But if the market doesn't respond. We know the path that we're on. Can we at least agree on that? And then at least you can set them up and be honest, but not lose the listing. And this just helps educate them on the process, that there is no magic. There's no way to get a buyer to come in and pay for a property, Overpay for a property when the real estate's a pretty efficient market.