Farm business dashboard: A scan of the business operating environment - Matt Dalgleish
Matt Dalgleish (Mercado/Ag Concepts) presents a ‘farm business dashboard’ that summarises global and Australian agricultural market conditions using percentile-style gauges and price charts. The talk introduces Mercado and its core team, explains the dashboard methodology (price-based gauges since ~2010), and reviews outputs (grains, oilseeds, pulses), inputs (fuel, fertiliser, chemicals, debt), livestock & fibres, and macro financial drivers (AUD, interest rates). Key points: global grain stocks are high (downward pressure on prices), Black Sea exports and freight costs affect Australian basis, fertilizer and fuel prices are historically low, and livestock/fibres look relatively strong into 2017. The presentation closes with practical hedging/management suggestions and a trial offer for Mercado membership.
Chapters
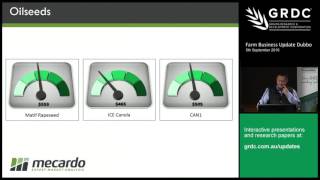
Get onto this presentation. So for those who don't know Mercado, we're a licensed, I guess it's a mixture of things that we do. We're AFSL licensed and providing commodity based advice. The Mikado is the brand name. So that's kind of the shop front, I guess, for want of a better word, which is an online portal and we distribute quite a lot of analysis on a few of the key commodities and then that flows through. So Mercado is actually owned by Ag Concepts, which is the company that runs it and employs myself and the other analysts. We also do quite a bit of risk management consulting type advice and marketing advice around that for multiple commodities where a. For those that are familiar in the wool sector with the Ryman wool trading platform, the forward platform, we broker for that. And most recently as well there's also now Ryman Livestock forward trading platform. It's an online standardised product for cattle and sheep. So we service both producers and consumers across the key kind of parts of the agricultural industry. Just quickly to give you a bit of rundown on the key staff, we do have some other kind of, I guess subcontract staff that work for us as well. But that's the four key people that you see with most of the analysis we put out. So Robert Herman on the top Left is the MD. He's had 30 plus years of knowledge within the wool industry predominantly and also grain is in livestock marketing and risk management. Andrew Whitelaw in the centre top there is our business development analyst, Business development manager and also analyst. He's actually had an IT background originally but over a decade's worth of experience in grains both domestically and overseas. Below Andrew is Angus Brown. So Angus is an ag science background. He's one of our analysts and consultants that's based out of Hamilton. So he's got a family farm out of Hamilton, mixed family farm and he kind of does a lot of the analysis on livestock and grains and a little bit of wool. And then of course there's myself on the. On the top right hand side there. So as Andrew had said, my background's economics originally and education. So yeah, for a long part of my career I was in the banking sector and trading foreign currencies. Not quite as glamorous for those who have seen the Wolf of Wall Street. Not quite like that, but it's a little bit more sedate and I've made the move across to agriculture about a year ago to join the team at Mercado. So predominantly with livestock analysis. But I'm Also responsible for the wool trading and the livestock trading platforms. Looking at, and also looking at minimum price contracts for wool and options and derivatives is basically my key focus. So now this dashboard, the idea of it obviously is sometimes when you're looking at all the markets and the different prices and the supply and demand concerns that are affecting and they're quite complex sometimes problems that are multifaceted, you kind of start to feel a bit overwhelmed with all the stats and figures. I think for people with my background in analysis and economics, for us, we love our kind of work based enjoyment is looking at graphs and figures and numbers. And I'm sure a lot of you out there, you feel like that when you look at graphs and figures and numbers. The idea of this dashboard is to basically give you a summary of where the markets are at. Now the way the dashboard's constructed, it's pretty much like a gauge you see, like a fuel gauge. So it's sectioned off into five parts and realistically it's looking at what the price action's done in simple terms over the past, since 2010 for most of the commodities and inputs we're looking at and it's basically going to cover quite a few things. So on the output side we're looking at grains and oilseeds, pulses as well. And then we're going to look at some of the inputs, fuel and fertiliser, we're going to have a bit of a look at livestock and fibres for those that are into the mixed farming enterprises. And then obviously effects in interest rates kind of fairly key that cross over a lot of commodities have an input in a lot of those things. So we're going to focus on that as well. The beauty of these gauges I guess is that we have an indicator that can give us a really good clear picture of what's happening with supply and demand fundamentals in markets. And, and that key indicator is the price. If you think of it in the sense that everyone that's focused and looking at markets, depending on whatever side they're at, whether they're buyers or sellers or advisors or speculators in some of the kind of exchange traded products, they're all pouring through all the data and they're making their decisions based on what they think is going to happen. And a lot of that filters down and funnels down into what happens with price action. So when you do look at something and if you can look and focus on, to try and clear your head and just focus on what's the price doing, sometimes that can give you an indication as to what's happening with that underlying supply and demand. And that's where we got the idea for these gauges. So we're going to the first lot of gauges looking at grain. So these figures that are there, obviously the current price as of last week and it's in Australian dollars a tonne on the bottom and there are figures off the old crop prices. So the gauge is basically showing over the last. Since 2010. The whole. If you think of it I guess like a. For those that are familiar with percentile tables, you could probably think of it like that. Up at the top section of the dark green segment is when you're up in that kind of higher end of the percentile up to the 100 percentile right at the very end and then the middle color green in the center there is around the 50th percentile. And then obviously as you come down towards say CBOT wheat, you can see it's right down in the low levels of minimum percentiles I guess is a way of thinking about it. Or for those that remember the old scorecards, you could almost think of it like an A, B, C, D and E in terms of how the markets are progressing. So with regard to grain you can see that, well, most of the regions around the world, I guess excluding France has had fairly good production and France has been having some impacts with regards to weather. So you can see that the levels for motif wheat are obviously sitting at higher levels and a reasonable basis. But that's a production issue that's there. When you compare it to what's happening with C bot wheat, it's quite a lot higher. The C bot situation, we've had four good years in a row in terms of production, I guess in the global sense end stocks for Wheaton corn are at record levels and we really do need something to go wrong to get these spikes. But I don't think it's going to happen prior to harbor. So we're in for another this upcoming season for a low price environment. View some key issues that are kind of affecting Australia, I suppose and there's three that we'd probably cover in this talk is the situation with freight pricing. We are starting to lose some of our geographical advantage. And we'll have a look at the Baltic Dry Index which is an indicator or we can have a look at it in question time. But it's basically an economic indicator that gives you an idea of what's happening with regard to freight pricing. I guess at its peak the Bulky, dry. When it was up at the highs, you were Talking about, say, $100,000 a day cost for shipping costs, and we're now down around $4,000 a day shipping costs to get these bulk freight handlers moving. And the fall in that kind of Baltic shipping index and that reduction in freight pricing just means that places like Russia and the Ukraine can now come into markets that were traditionally more Australian markets from the export sense, such as Indonesia, say, and they can be competitive. So that's kind of has been weighing on the Australian ability to export and I think it's going to continue into this season as well. If you look at something like Russian exports since 2001, it's been on the increase and for this season it's expected to be around that kind of 30 metric mean tonnes to come out of Russia out of a production of about 65 MMT. And that's just Russia. If you take into account the kind of old Soviet Union empire that produces wheat, I think they're looking at about 117 metric tonnes for this season to be produced. So that's got to go somewhere. And it is starting to infiltrate into, like I said, into areas like Indonesia that's traditionally been an Australian kind of export sector. And this rush of wheat is a reasonably good quality, so it is meeting the expectations of the millers there. And it's cheap. So that's going to kind of continue to cause issues. The other factor we're going to look at, I guess as well is a few things that have come up in some of the other business updates that have done with regards to the protein. There is some suggestions that have been coming through the markets that there might be an inability to kind of chase some higher protein wheats with the wet weather we've been having here, certainly in parts of the northern hemisphere, that there might be a shortage of the higher protein. So is that a question of whether we want to kind of go and try and see if we can, for this upcoming harvest, get down some urea and try and build that protein into the crop? I'll just move on to looking at just some of the dashboards with regards to the different kind of levels of wheat. And you can see that with regards to where we're sitting now, there's not a great premium built in just yet for protein. We think that the premium will start to flow through as we progress into the next harvest, but I'm not sure if the strategy to kind of chase that protein is going to be the best one to follow through. We Think the basis generally will start to narrow coming to this next harvest. Obviously the huge crop we're expecting at this stage, there's reports that there's fairly low grower sales around the 10 to 15% level of sales so far. Normally this time of year we'd be looking at about 30%. And obviously that Black Sea competitiveness that's going to kind of start to bite into basis locally, I think, and we'll see that basis narrow. Just with regards to that issue of protein, there has been some suggestions as well just recently that Russian farmers are holding onto some of their higher protein weights, waiting for the premium to come. But if you're thinking of that as an option for yourselves to put down some more urea or something you want to talk to your agronomist about and just see whether that's going to be of benefit to you just in terms of what the outlay is as opposed to what you might get if the premiums of proteins does start to increase as we head into harvest. Switching to oilseeds now. So we've got the motif rapeseed which is the non gm and you can see that on the far right side is the local physical non GM canola. So you can see there's a much closer relationship in terms of price where those two are as opposed to your Canadian ice canola. And obviously the local physical non GM tends to follow that European price a little bit more. Obviously there's a lot of exports that go through to the European sector from Australia, then ends up going into GM meal for high protein feed for dairy and the chook industry. And so that's why there's a bit more of a correlation between the two there with regards to the ice canola earlier in the year, say May, June, there was some concerns with production in Canada initially and they thought they might have had a, a tougher season. But since then conditions have improved. So it looks like Canada on record for a bit of a bin buster. So, you know, the prices there have started to ease. It's been pressuring prices down. I guess at a local level the demand for that canola meal is kind of low due to what's happened with the dairy industry. And so there's less kind of demand and that's kind of pressure in the complex somewhat. Moving on to some of the other oil seeds so that they're not the charts up there for this one, but other kind of derived also type products. You've had a downward adjustment for soybeans within South America. There was some adverse Weather effects, El Nino related weather effects. So that kind of expected for soybeans to kind of have a reduce in production for that season. And so the prices kind of had a bit of a spike in that kind of period of time. And with regards to palm oils, that's the world, I guess, leading vegetable oil, it's expected for the first time ever that palm oil production will shrink for the first time in 18 years again due to the El Nino that happened earlier in the year or that would come off the back of the El Nino from earlier in the year had affected some dryness into the southeastern Asian regions. Export demand from China for soybeans have increased. So that was supporting the soybean market. But there have been some production issues out of Brazil. So it's a bit of a mixed bag there. So that's kind of where we're sitting with regards to oilseed pulses. Now we don't have in terms of the data for pulses, there's not enough long term data, I guess, in terms of our database to make those gauges meaningful. So we've just got a price chart of the patterns in what the price has done since September of 2015. And like I said, the data is key for this one. On a global basis, pulses and chickpeas are a fairly niche product. And so with regards to those niche type markets, you can get a little bit of volatility around the price movement. Certainly, as the chart shows, it was looking quite good. But you can't always expect with these niche things. It's not always the case that with a niche thing, you get a niche market, you get a big premium, it can be reasonably volatile. The reason for that build up there, India being the largest producer and consumer of chickpeas, they have had some production issues over the last two years. So fairly bad droughts and now they're going through floods. And that was part of the reason for the buildup in price there. But most recently that kind of high price has acted as a signal for other areas to potentially go into that market. So you've seen the Russians start to move across and start to direct some of their production towards there. And then prices have come down on the back of that increase in supply. Now turning from the outputs to some of the inputs, I guess the fact that we've got some low prices in the outputs across the board is not great. But on the positive side, for the majority of inputs, we're seeing reasonably low historic prices as well. If you think of it in terms of your fuel, your fertilisers your chemicals and also your debt as an input. Out of those four, there are three of them. Your fuel and your fertiliser and your debt are all at fairly historical low levels. So there's a lot that The Meatloaf song 2 out of 3A isn't bad. Well, in this one that's 3 out of 4 isn't bad in terms of the cost there. Looking at the crude oil, so we've seen a fairly decent crash in the prices of crude oil obviously on the back of slowing world growth and GDP after the gfc. So that's put the price under pressure for crude oil and places like Iran that are now kind of coming back online with regards to increase in production that's going to. And they've got quite low production costs in Iran that's going to continue to. To place topside pressure on crude oil prices. We've got the Singapore petrol price that's pretty much a proxy for diesel. Obviously they are fairly highly correlated diesel and petrol. We use Singapore as a proxy for diesel just because it's a little bit more transparent and again the data is more available in terms of the reliability of the data. So you can see that as an idea of where diesel's kind of sitting as well. And in terms of the local fuel prices at the pump here, our local prices are pretty much driven off the back of the Singaporean market price there. And that's largely because in Australia we don't have very big refining capacity. So most of our refined fuel comes out of Singapore. Historically, I guess you could say that traditionally you'd look at about a 40 cent premium on top of what the Singapore price was, is what we used to pay in Australia and now over the last decade or so that's risen to about a 70 premium above the Singapore price. That's largely due to excise taxes and things like that that have kind of made our fuel locally a bit more expensive. One way to look at I guess your inputs as well is to treat them in a similar way to your outputs in the sense that there are facilities and certainly in these low price environments it's something to consider that there are facilities out there to hedge your, hedge your exposures and cover your price risk with regards to your input costs as well. And fuel's no different. So some of the things, I guess a simple thing would be if you've got the capacity you could buy and just store some diesel on farm. But that's probably not the best of the three. Some of the banks are offering. Oh, sorry you can go out and buy forward contracts as one option, but the other one that's something to consider with regards to your fuel is some of the banks are offering a fuel swap that can be done and they're starting to push that product. But one kind of thing, that limiting factor is it is a 500,000 litre minimum on the swap. So you have to be using at least that per kind of season. So that kind of might knock most people off. But, you know, hopefully as the market kind of gets more sophisticated with regards to these products, those kind of minimums will come down. These are just early days yet with regards to some of these, some of these kind of hedging tools. And so as it becomes more common, you'll find that those kind of hurdles start to start to get down to levels that can be accessible. Moving to fertiliser now, just want to clarify the prices you see here, again in dollars per tonne, but they're not the prices that are local to here, they are world prices. And look, they're mainly used to show the direction of where we could be heading. With regards to your kind of fertilisers, obviously you've got your DAP from the US Gulf, that's the US Golf price, your phosphate from Morocco and the urea from the Black Sea price. So don't go rushing off to your fertiliser supplier and say, I can get $233 a tonne for my urea, because it's not the case. In fact, a colleague of mine was down in Tasmania last week and he was chatting to a farmer that said that the DAP there, he was buying at $800 a tonne in Tasmania. So, you know, it's still significantly higher than what you're getting in terms of world price there. If there are any fertilizer salespeople in the audience don't have a crack at me. We know there's other aspects as to why the local price has a premium to it in terms of shipping costs and storage and insurances and everything else, but it's really just an indication that we see if the world prices are where they are there then. And looking forward, there's no real, no real kind of obvious reason as to why they're going to go up. So we're probably in for another good couple of seasons of low fertiliser prices. There's been a good number of plants commissioned in Europe and North America. In a general kind of demand supply sense, the supply has kind of outstretched the demand. You're looking at for the next few years, the supply is going to probably increase at about 4% a year and that's going probably out to even 2018. And demand's really only growing at 2% a year. So for the foreseeable future we can't see that fertiliser prices are going to kind of have a massive rally anytime soon. One of the kind of demand source aspects of fertiliser has been the mining industry for explosives. And there's been a downturn in that obviously with the downturn in the mining industry. So that's kind of a consideration that you're looking at a situation where both on supply and demand side, you can't see any real reason for fertilisers to increase in the next few years. Natural grass is a big kind of feedstock for nitrogen based fertiliser. The correlation between natural gas and fertiliser prices are about 0.88. So for those that are statistically minded, that's quite a good correlation. And natural gas, again, along with crude oil, the prices for that have dropped quite a bit. So that's kind of helping, kind of keep fertiliser price down. There are options in terms of what can you do to maybe hedge any fertiliser exposure you might want to do. Again, a simple one might be if you've got the capacity to buy it and store certainly doesn't degrade like other things that you can store on farms. So that's a potential option. But there are also fertiliser swaps available on Chicago. Some of the banks are starting to look at that as an idea. But you might need to source yourself a broker if you're interested in looking at fertiliser swaps. And given that they are an overseas based swap, there is still some basis risk in that. So you've got to consider that before you kind of jump in livestock and fibres. For those that are, that are kind of in the mixed environment there and might have a few steers running around or a few sheep. We've obviously this is one of the positive signs for agriculture in terms of what's been happening with prices there. Obviously the EKI's still been holding up reasonably well. Actually I think it closed on Thursday at 7.05. So that just was produced on Wednesday. So that was the reason for price being a little bit there. We did see record highs this season of $0.25 for. For young cattle. The correlations between Australian cattle prices and the US in a longer term sense are quite strong as well, and that's largely because we export 70 odd percent of our beef. And then also the US are a very big competitor to Australia in some of our prime export markets like Japan and South Korea. And the relationship between the two, like I said, in the long term the correlation between our prices for beef and US prices are fairly strong. We can get some short term divergences, but by the whole they kind of tend to follow. Going through the 2013, 2015 season, we did see a stage there where our beef prices were quite undervalued compared to overseas. And now that we've had this big rally and the reverse is the case now, we're getting to a stage now where our prices are looking slightly overvalued for beef. When you compare it to what's happening overseas in the US in saying that, I don't think prices are going to kind of collapse. There's still some good underlying demand there from restockers. Obviously the good season we're still yet to have with regards to the wet weather and then the spring coming in and a lot of it'll be abundant grass around. So that's going to continue to kind of support cattle I think into that 2017 season. We're looking at fairly low supply going into 2017 as well. So generally speaking we're probably in for another good year for cattle. Sheep's not much different in terms of the fact that you've got your Australian dollar is reasonably low. So that's kind of supportive of the sheep exports. There's about 55% of our sheep and lamb are exported, so the Aussie dollar helps there. Again, we're moving into a kind of a tight season with regards to what's happening on the supply of sheep and lambs for 2017. So that's going to be supportive of prices, prices there going into this next season. And then as we head out towards the end of the decade, supply is going to start to increase. So then you'll see prices drift off. Your last one there is your eastern market indicator for wool. And again the wool market has had fairly solid kind of, I guess 15, 16 months or so in terms of price movement. We're up at the, heading into that top percentiles area looking at what's forecast with regards to supply for wool as well. That's kind of the kind of changing composition of the flock over the, the last decade or so has seen a move to kind of prime lamb. So the general kind of supply of wool has been on the decrease and that's kind of generally been supportive of prices. About 80% of our wool ends up in China these days. So the marketplace over there, some of the bigger Chinese mills have kind of been chugging along as per normal. Some of the medium sized ones have been kind of getting a lot of business off, off the back of the bigger ones. But there has been some signs from some of the exporters saying just this season that they're seeing some of the medium sized mills starting to want to get out there and get involved a bit more directly with Australia. So that's going to be, I think, supportive of demand from the export side of things with regards to wool. So it looks as though another good season for fibres there in Australia with regards to wool. So these are probably the three commodities across the ag sector that are probably going to have another reasonably good year in terms of prices for next season. Moving to some of the financials. So like I said before, the Aussie dollar being where it is now after a good number of years and even up above parity around that 2011 time frame meant that it was quite difficult. We're now back into kind of a more normalised situation for currency, if you think since, since 1994 in terms of an average price. Since then to now, the Aussie dollar has been around $0.77 as an average, so we're currently below that. The 2016 average is about 73.7 or so, so we're a bit higher than this year's average, but it's still reasonably good. Since 94, about 70% of movement in currency has been between 63 cents to 90 cents. So. So we're kind of sitting mid range, if you think of that. Some of the forecasts that the banks are putting out for currency to go below $0.70 into next year, I think they were calling the same thing at the start of this year, but it did rally. I think overall pressures with regards to currency are likely to be towards the downside. We've had a recent meeting with the Federal Reserve over, not last weekend, the weekend prior with regards to what the rate policy is going to happen in the States. And they're starting to look towards increasing their interest rates coming within this year. I believe there was some suggestion they might have even increased rates in America as early as this month. And so that kind of put the Aussie under pressure the last week. But yeah, over this last weekend just gone, the employment figures from the States came out a little bit softer than we expected. So that might push back to maybe later in this year we could see a rate rise in the States, we've got the potential for probably another cut or two to come in Australia in terms of interest rates. So that's going to continue to pressure the Aussie. I think when we start to see that flowing through that interest rate differential between currencies is a fairly big kind of long term driver of where the currency is heading. And I think the first stage will be that when the US raise rates, which is likely to be this year, we'll probably see another cent or so wiped off the Aussie. And then once Australia and the RBA in Australia potentially cuts rates again this year and potentially early into next year that we could see the Aussie then start to head under 70 cents and that's what's driving a lot of this bank kind of forecast for it to be below $0.70 into 2017. And obviously the cash rate picture there in terms of where we're sitting at record lows at 1.5% for the RBA cash rate. But if you consider looking at. So that's the green chart is the local RBA cash rates and you see all time lows there. But when you compare it to the chart on this right hand side, which it is a bit messy and a bit colourful but you can see that the green ones, the Australian rates in terms of the cash rate and all the other colours are basically the rest of the world. So you can see comparatively even though we're experiencing incredibly low rates in Australia compared to the rest of the world, we're still reasonably high. And that's one of the things that has been supporting the Aussie of late in keeping it where it is. And certainly the forecasts from the banks of being under 70 cents have been pushed further because of the fact of what's happening overseas in the US and Europe and, and other places, Japan with regards to their rate environment. I did hear an interesting point on the radio would have been about a month ago after the RBA cut rates in Australia, one of the commentators had said that in the UK it's the lowest they've had rates in 315 years. So that's quite a. Before the white settlement of Australia the rates haven't been any lower. And just recently I read a Merrill lynch article where that one of their analysts had gone back through the historic records of Egypt and going back to Babylonian and looking at some of that kind of data they could have in terms of what was happening there and they're suggesting that the rates in the world are the lowest They've been in 5,000 years in the rest of the world. So it's quite low rate environment. And even with the US potentially looking to increase rates later this year, it's still going to probably remain a fairly low interest rate environment for the foreseeable future. I think in terms of what's happening with regard to global demand, that's just a chart of the Aussie dollar forecast for some of the major banks. You can see there's the majority of the kind of predicting it within the next 12 months to be either at 70 cents or lower. There's a couple that are out there calling it higher. That's not uncommon for economists. There's an old adage, you get eight economists in a room and they'll give you eight different versions of what's going to happen. But definitely the consensus is for the Aussie to be below $0.70 within the next year. And I kind of tend to agree that that's the case where we're heading around that kind of high 60s. It probably won't go much below 65 cents though, I wouldn't think. And just some final thoughts just with regards to things to consider with regards to your marking and not just I guess for the scenarios of what we're saying, what's happening with your outputs and trying to kind of have a plan for low prices for your outputs and also just as much you have a plan for high prices, you can also try and be prepared with regards to what's happening for your input costs. And for those that are worried about the low prices that are in some of the commodity markets at the moment, just have a look at that second quote by Thomas Fuller and just consider that sometimes it always looks worth right at the bottom. So hopefully with a bit of luck we can see some improvement from here. Just a quick reminder of where I'm from. At Mercado, we do have a free trial period for members. So if you want to visit the website and come and have a chat to me at some stage during the day, I can give you a brochure if you're interested or check us out on Twitter. And I think that pretty much wraps me up for the now it's up to the questions. Thanks, Matt. All. Right.
More from Gerri


GRDC National Variety Trials (NVT) Case Study: Helping Oat growers make informed variety decisions

Managing rhizoctonia in wheat and barley: Impact in low and medium rainfall zones 🌾🌾