Mike Smith, a farmer near Moree NSW, collected 10 years of yield and protein data to map his paddocks into management zones. He uses variable-rate fertiliser matched to each zone, cutting costs while balancing nutrients. His advice: keep it simple, collect consistent data, and don't recalibrate mid-season.
Questions this video answers
About 50 kilometres southeast of Moree, northern New South Wales.
1913 (grandfather bought the place).
1996.
About 30% variation.
221 kilos (average).
Chapters
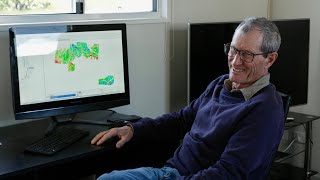
What we've got here is a map that is based on a whole lot of data that we've gathered over a number of years. If you've got 10 years worth of data, you want to get that data back to a single point and then we drop it into a stats program. And so we've used the stats program then to what they call cluster or build zones. And it just says, well, I want to find five zones or four zones in this paddock that are similar. And it just looks at all the data, whether it's 10 years, 15 years worth of data, and it'll give you this map.
It's not the new face of farming, but these days it is a more familiar one.
Mike Smith. We're on a farm. We're 50 kilometres southeast of Moree in northern New South Wales. It's a family farm. My grandfather bought this place in 1913. We started with a yield monitor in 1996, so we've been doing it for a while. I spent time as most of the young blokes, when they come home, they want to drive the header. So I was on the header and you're just looking at the variation in yield. Well, when you can see the variability in the yield from the header, it's probably about a 30% variation. So when I read about YieldMonitor, I thought, well, that'd be really cool if we could actually measure it and quantify it across the paddock.
That quantifying happens via various forms of variable rate technology, which falls under the umbrella of precision agriculture.
We also have a protein sensor on the header, so we've gathered protein data. So what I've asked the stats program to do is give me the average yield for particular zones. You can see the colors and the areas of those zones. Again, the protein. We can work out how much N we've put on, so we know how much we've taken out with the crop. And we look at the N balance and we've got a costing here to cover the N and the P that was put on for the crop. So when we go through to how that translates into costs is we spread an average of 221 kilos across that paddock. So the top rate was 315 kilos. The bottom rate was 159. Had we thought, well, we really need to target our top yield or area. And we sped 315 across the whole lot. Our savings with variable rate for the different areas work out at those tallies up to about $21,000. As these fertiliser prices are getting higher. It's I guess variable rate is starting to be pretty interesting for everyone. So.
So what tips does early adopter Mike Smith have for other growers?
Don't over complicate things. I think pay attention to getting yield data. Don't be absolutely hell bent on having the yield monitor dead accurate. If you're going to calibrate with a calibrate right at the very beginning or at the end, don't play with it through the season because as soon as you start calibrating through the season, what happens is you're going to shift all your yield data. The yield data is very important because ultimately that's what you get paid for. So you want to know what's going on. I guess it's just trying to do it better. If we've got the information, well, why not target it? I look at it as an opportunity to say push our country better, look after it better, try and maintain our nutrient rates and we're not wasting it on the poorer areas. So just makes sense to be able to try and do it. If we can measure it, why not do it?