Anything Could Happen For Bitcoin Right Now... Beware...
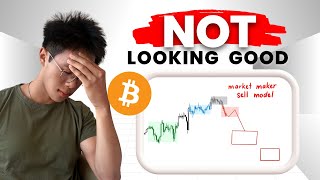
Bitcoin's long-term trend is bullish, but short-term structure is mixed ahead of the Fed rate cut on Sept 17. Watch 111,400 as a potential flip point, with key resistance near 112,500 and support around 105,000. The biggest move likely comes in the USD news window between 7:30 and 9:30.
Chapters
Welcome back to another video. Yesterday's trade ended up being a banger. I think the setup for today is going to be pretty straightforward. You're going to want to look for a one hourly candle close above the level of 111400. If you get a close above 111400, this entire block here becomes a potential bullish order block. And so Price, like break out, come down to retest, and off you go. You're targeting it to R. And that marks the 99th win out of the last 124 calls that we've made here on YouTube. Now, if you were paying attention, like, Price did not actually back to the level that I initially expected it to retrace, which is over there. Instead, Price stopped at this order block right here and started going up. Now, what's interesting is that if you follow me on Twitter, I actually just kind of like did a little bit of a live trade with you guys saying that, hey, guys, exactly at this, exactly at 9:33pm I've already scaled into a long. So just taking a Look, this is 9:00am, this is 9:15. And you would have had the opportunity from 9:15, 9, 9:30, all the way until 10:15 to where, you know, you scale into a long and boom, off you go. So if you haven't followed me on Twitter already, I'm going to give you a better reason to follow because, like, I've also broken down exactly the trade on, like the thought process that was going through my mind when I was taking trade, posted it on Twitter. I'm going to leave the link in the description box below. But if you guys just want to get, like, follow along, like, like if I am posting any live updates, stuff that I wouldn't otherwise be able to do in a YouTube video, like, when it's actually happening, I'm usually doing it on Twitter, so feel free to follow me there. But otherwise, let's get into the video today and try to replicate the success that we did immediately. There is a couple of things that you guys need to know about today. One, it's not looking good. And two, long term wise, we are still good, but like short term wise, yeah, just not looking amazing. So just to break it down for you, so far, we are still within this weekly order block right here, which means that more likely than not within these three weekly candles here, we are anticipated to go up from here. Now, I don't know if it will be this week or next week, but more likely than not, the date that you want to pay attention to is September 17, because that is when you get the next federal funds rate event. So let me just pull this up so that you guys can see. So on September 17, this is when you get the federal funds rate. And again, this is going to mark at the very moment, based on current odds, there is about an 80% chance that we're going to get a rate cut. And if you know anything about risk assets like Bitcoin, like the stock market, NASDAQ, S&P, whatever, they thrive in situations where liquidity is abundant. And the only way for liquidity to be abundant is purely, well, at least the biggest determining factor is going to be the interest rates, amongst other things, of course. So interest rate down equals good for the market. And we're very likely about to get that moving forward on September 17th. So that's why, that's my thesis behind why. You know, it's not a coincidence that price is currently at some kind of bullish order block on the weekly chart exactly a couple of weeks before the rate cut event. Now if we zoom into the daily chart though, we can also like kind of like narrow it down to around $105,000. This seems to be the consensus kind of level that everyone is kind of looking at and I can see why. But before we get into that, just understand that if you were a long term trader, like if you're a swing trader or whatever, like uptrend is still very much intact. I sound like a broken record saying this each and every day, but the truth is the uptrend is very much intact. There is nothing that has fundamentally changed, nothing that has technically changed. Like you are still within high highs, higher lows, order flow is still bullish. Everything is still bullish basically. As long as price remains bullish, as long as the market keeps showing you that, hey, you know, it is bullish. As a sound investor, the thing that you do is to just trade accordingly to what the market is trying to tell you. Worst thing you can do is have some sort of opinion of like, okay, price needs to go to $105,000. Oh, price is definitely going to go below $100,000. Like sure, you may be right, but what if you're wrong and you don't act on it and the market pumps from that point onwards. Food for thought. But anyways, like if you're a long term trader, look to accumulate your positions here. Like it doesn't matter if you get in here, if it get in, if you get in at $105,000, like this is overall long Term. Well, I say long term, but, like, over the course of the next two to three months, this is going to be a great entry, at least based on what we can see at the moment. Yeah. Anyways, the moment we narrow it down to the daily chart, you can see that this is a liquidity level. And this has already been swept, so we're not going to consider this anymore. But so right here at $105,000 flat, that is when you get your next liquidity level heading right into some kind of fertility gap right here, right underneath the liquidity level. Also, of course, you have the original bullish order block that started everything. And so, yeah, if you come back into this area, this is very much a high confluence area. And it's all going to make sense the moment I explain why I'm looking at this level in the first place. So even though yesterday's candle closed bullish, so far today it's not been looking pretty. And another thing to keep in mind is that this is a fair bit gap right here. As much as I would like to tell you that the setup for today is going to be super obvious, we're running into another situation right now where, like, we have reasons for believing that the market's going to go up. We also have a really strong reason for believing that the market is going to go down. So if you guys remember, like, I was already talking about the fact that this is a bearish resistance zone. And until proven otherwise, basically, until you trade above 112,500, any longs that we do that we do take, it needs to be taken with, you know, a grain of salt, with a bit of caution, because so far the daily chart is still in bearish order flow. And until that changes, like, doesn't mean that we cannot go long because we have been successful. Like, we had three days in a row where we caught the correct move because, you know, we went long and doesn't mean that you cannot go long, but you need to be cautious with it in a sense that you want to remain flexible and to be able to change your thesis and change your bias if necessary. Otherwise, just looking at it purely from yesterday's daily close, we closed bullish, which means we are looking for a bullish trade today. The majority of today has been trading underneath the daily open, which, if you know anything about the power of three, is an amazing sign. Right. If you have a bullish day, you ideally want to look for a trade underneath the daily open. So you want to buy low right below the daily open, so that you can sell above the daily open for the true expansion. This is the case for this bullish candle, right? The low of the day forms obviously underneath the daily open because we were bullish on this day. So eventually price goes up and you sell high. Same for yesterday. We buy underneath. Like this is also the reason why we were able to kind of predict that yesterday was a accumulation, manipulation, distribution kind of setup in the sense that price opened up, I think here, and the price dipped down below during your London session. This is when I caught the bottom and price eventually distributed towards the upside. So this is a clear example of what I mean when I say power of three. So today has been forming a very similar setup so far in the sense that, well, you have swept out some kind of liquidity and you are coming back into a daily fair video gap. So by all accounts, this should be a bullish piece of news. This should be okay, we're going long. Problem is like, just like what we've discussed earlier during, earlier on, during the week, we have a potential market maker sell model going on right now where this is the original kind of accumulation. You have like your second impulse up here, your third impulse up into some kind of key level right here. And so far price has gotten a change in state of delivery. To explain to you what is a change in state of delivery, I want you to take a look at price action here, right? This is a bullish order block. The moment the price closes above these series of down close candles, you are now in the start of what is known as bullish order flow. And of course this continues like price retraces back into this bullish order block, succeeds in not breaking through it and actually pumps and forms a new high. So now you validate a new order block right here and then price breaks above and then boom, you come back down. This is the essence of order flow, right? It shows you like one level deeper. Like what is the market actually doing? And obviously for bullish order flow to remain intact, you want to see bullish order blocks be respected. You don't want to see them getting traded through. Traded through is one thing, but you really do not want to see them get closer. And in this case right here, you could to re realistically say that this is now like a new bearish order block, at least a potential bearish order block. Now this is where you start to see the conflict that I initially talked about, which is this is a reason why we think price is going to go up. This is also a deep reason why we think prices are going to go down. I'm going to give you my take on this and like, exactly how you can take advantage of this. But just understand that this is the type of data that we're dealing with. For example, yesterday and Tuesday was amazing, right? Price was just playing out clearly and there was very clear direction. There are also days such as today as well as Monday, where it's a little less clear. Now, it would be stupid of me, especially, like, it would actually be irresponsible of me, not to mention these risks and not to mention, you know, what is going through my mind, because it's very important to take into account the type of day it is and the type of market condition that we're trading in. And in this case, this is definitely something to keep in mind. But for now that we're going to try to narrow it down, like, try to get into the nitty gritty and see, you know, if there are any potential levels or like any potential theses that we can kind of come up with and just kick things off in the one hourly chart. This is going to be a, some kind of favorite gap right here that ideally, like, if we are going long for the day, we actually want price to sweep out this further gap right here. So starting at $110,100, ideally it would be to sweep. But you can also argue that if you were to go all the way down there, then, yeah, you know, why not just jump into a short instead? So short levels, you're going to have a couple, like, that's the first February gap. That is your second favorite gap. And then obviously you have the original order block right here. So to trade things lower, the areas that we're going to be looking at is 110, 900, 111, 300 and 111, 700. Now, I do not actually know which ones of these are going to get respected and which ones of these are going to be the quote unquote top or in the event that you go long, I'm pretty certain that is going to be the bottom. Heck, you could also just pump from straight on, like from this point onwards. So it is not the, I think it's a very common misconception that, you know, as humans, it's, we're wired for certainty, right? We always crave certainty. We always want somebody to tell us, like, okay, that's going to be the ferviding gap that is going to be rejected. Or this is the exact bottom or like, this is the exact range. But ironically, it's that craving for certainty or like that pursuit of certainty that causes most people to be to get really terrible results from trading as well as investing. Because the truth is this is a game of probabilities. This is a game of incomplete information. There is never a single instance in time where the odds of price doing this or that is 100%. The reality is it's always more like okay, 60, 40 or like 70, 30 or like, you know, there's always odds, there's always a chance that you can be wrong. And so rather than trying to create certainty in a place that certainty cannot be found, why not just come to come to terms with it? Like nothing's ever going to be certain. And it's all about like your success or failure as a trader slash investor. As long as you're playing the financial markets, actually your success slash failure is going to come down to one thing and one thing only really. It's just taking the higher probability outcome each and every time over the lower probability outcome each and every time. Extrapolate this to the long term and that's when you start seeing magical results. So if it's 60, 40, if it's 55, 45 and you do that over a thousand and trades, guess where you're going to end up. Especially also if your risk reward is higher. Like let's say if you get two units of reward for one unit of risk, amazing. You can see how those numbers are going to add up. So yeah, it's not about predicting, it's more about just preparing. Like what I'm telling you right now is I'm giving you the three kind of zones that you want to pay attention to and in the event that you get into these zones and Price does the behavior that we're kind of anticipating and only if those conditions are met, then we get into some course of action. Right? It's an if, then statement. I'm just preparing you for the scenarios that are likely to happen and when. Like what Price does at that certain timing. It's what we're going to get into next, which is today's Thursday and at 8:30am we have news, USD news. So ideal, like the ideal trading window for today is going to be between the hours of 7:30am to an hour after news, which is 9:30am if you guys recall from yesterday. Like one thing that I definitely said was you want to look for the trade to happen anywhere between 9am to 11am and I want to just show you like exactly when the move began. Like the moment we go into the 15 minute chart 9am is when we start getting pumps and then the pump actually lasted all the way until around 10:30, 10:45 and then boom, the rest of the day just goes into choppy mode. Similarly on Tuesday we had 10am news as well. And I said to look for the pump at 9am to 11am because the news was at 10am, an hour before news and an hour after news. 9am right there is when it began. And look at when it start like it ended 10:30, 10:45. Like this stuff happens like clockwork. Whenever you have news days, look to trade in the hour before news and the hour after news and you're going to get like just amazing results. So for today, like whether we go up or down highly depends on where price is prior to news. For example, if you are here by the time 7:30 rolls around and you start, you know, kind of breaking lower, then you can reasonably anticipate the move between 7:30 to 8:30, maybe 9:30 to come all the way down to this level right here, potentially even lower. And if you have swept out this level right here in the hours of 7:30 to 8:30, then you can reasonably anticipate price to go towards the upside. It's as simple as that. It's less about like a lot of people just focus on like the behavior price, right? Technical analysis, that's what we all focus on. But the reality is like technical analysis, or rather the behavior of price is just one part of the equation. The second part which needs to be there to complete the equation is timing, right? The behavior of price at certain timings will drastically might affect the probability of that new trade. Or like whatever that theory is, the behavior of price, I.e. specific timing matters much more than you think. But just to narrow it down and kind of like give you kind of like a big picture overview, right now we are bullish for the day. Like if we were just trading the system we'd be looking for longs. Problem is one hourly. We have already did a CISV and we are potentially dealing with a market maker sell model here. And so what that means is that there is a thesis for going long, there is also a thesis for going short. As for what to do here. Like it highly depends on what price, like where price is and the behavior of price between the hours of 7:30 leading up to 8:30, which is when the news hits. And you can expect the move to continue to last until around 9:30. So that would be my thesis for today. Now another thing to consider is that on the Five minute chart. This is your Asia range. So far you have broken below. So you can reasonably also say that this is going to be an accumulation manipulation, distribution, just like yesterday, right? Sweep below, boom, boom, boom. Right. Distribution. Today is looking kind of similar because right now you've also swept out some kind of key liquidity. You filled in some kind of key level. And so you can also reasonably say that this is bullish. So I'm going to give you like a final conclusion as to what the official call is. Before I do actually make sure you follow me on my Twitter because today is going to be one of those days where I am going to be updating things as we go just because of how, like, just because of the fact that I cannot make like a certain call at the moment. But for sure, we have definitely run into, you know, situations like this in the past before where a time frame alignment is just out of whack in the sense that daily is pointing one way, one hourly is pointing the other way. Usually what we do on these days is just not trade straight up. But to be fair, outside of the misalignment in one hourly chart and the daily chart, there is no other time frame or like, there's no other issue that I can see. But we have news today. Market structure is pretty clear and all we need to figure out is is the one hour move more likely or is the daily move more likely? And I will be inclined to think that the daily move is more likely because it is a higher time frame. And we can reasonably make an argument that this is kind of like an amd. And second of all, you know what, I was actually going to give you a like, official call, but the more I look at it, the more I just realized, like, it's a bit too early right now. I wish I could have recorded this video an hour later, but unfortunately I have somewhere to be. So guys, like, unfortunately, today's not going to be one of those days where I can give you a call. All I can tell you is pay attention. Like the call is going to be pay attention to what price is going to do at 7:30. That is honestly, genuinely like the responsible answer. Because right now I can make an argument for long, I can make an argument for short. And like, honestly, they're both super valid. So this is not some kind of show. I will definitely be present on Twitter heading into news potentially, if I've had, like, if I was able to record this video like an hour later, I would definitely have a much clearer picture. But I'm afraid that's the best I could give you. Again, not all days are like this. In fact, half the time. And again, like, it's. It's not every day that it's like this. Oftentimes that we do have a pre clear thesis. But today is just one of those days where like, yeah, I cannot. I cannot bring myself to just give you guys some lazy answer like, oh, yeah, price is going to go up. Or like, oh, yeah, yeah, price is going to go down. Fact is, even I'm not sure and even I need to wait for a bit more price action to play out first before I'm able to give you guys a conclusive answer. So, yeah, follow me on Twitter, turn on your notifications. And we're about to start the next intake of Bootcamp where you work personally. One on one, I will install all of my mental models, everything, all the advice that you hear from here and all of the trades, like, I will install it for you. Obviously you're going to need to put in some work as well, but if you're interested in that. But if you're interested to work with me one on one to achieve that, feel free to click the link in the description box below. But otherwise, guys, I'll see you in the next one.










