Bitcoin analysis from Hong Kong covering intraday long trades. The creator reviews a losing call, explains order-block strategy and timeframe alignment, and lays out two long setups with an invalidation level at 1H close below 114,000.
Chapters
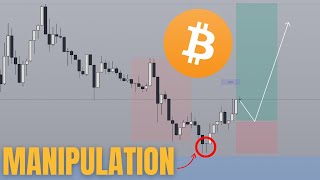
What's up guys? We made it safely to Hong Kong, which also means the daily videos should hopefully be back for the foreseeable future. Anyways, the last trade that I called ended up being a loss or at the very least my analysis ended up being a loss because I was thinking that after you swept out this low right here, you would start heading towards the upside. Alas, you did not get a change in state of delivery and prices ended up, you know, respecting that head and shoulders formation instead. So, so let me show you what I mean by that. That is like that hit, sorry, 1, 2, 3. And then you started heading lower. Eventually though you did started going higher. But still on that day itself, like yeah, my analysis was wrong unfortunately, you know, it is what it is. The daily order block back here was a bit too strong and you know, I should have definitely took that into account. But hey, you win some, you lose some. It still puts us at 90 wins out of the last 111 calls that we've made with the last one, the loss already being accounted into that. Anyways, in today's video I'm hopefully going to, you know, make a winning call and yeah, let's get into it. So on the daily chart, yesterday's candle ended up being bullish. However, we are still in a bearish fe gap at the moment. But because yesterday's candle closed bullish and today being a news day, especially at 8:30am, we're still going to be prioritizing longs today rather than shorts. So that's what we're going to do. I don't see any potential other resistance on the higher time frame, potentially this order block. But hey, if you are going to get back to this order block then it's very likely you're going to bust through it anyways. The reason being on the daily time frame you are still really, really bullish. Like nothing's changed over there. If you just take a look at even the weekly chart or the daily chart, you are still very much forming higher highs and higher lows. And so until basically like $100,000 or more specifically like $98,000 gets broken, you are very much still within the green. Especially if you're a longer term trader, swing trader or whatever, you're safe, like no concerns there. Price is very likely to continue heading towards the upside. But that is enough. On the daily chart, any potential that we can take into account is that price could technically currently be in some kind of bearish order flow. Like for example, this is a resistance you have so far failed below it. And so theoretically speaking should like the retracement should continue. Especially if you are familiar with, let's say Elliot Wave theory. You know you have 1, 2, 3, right? But then within here you have like 1, 2, 3 as well. Think currently 1, 2, 3. Potentially there's another impulse down back into this bullish order block right here before price actually starts to bounce. That is something we can keep in mind, but just within the context of a intraday trade. Again, this is what we're trying to do here. We're not trying to swing trade, we're trying to do an intraday trade, which means we open and close the trade within the same day, usually within the same session. And in the context of an intraday trade, we take into account the daily bus, which means that we should today be looking for a long and now we hop onto the one hourly chart and we start looking for PD arrays that might support this theory. And already I think we can see a bullish order block over here where price is very likely to fill before going towards the upside. And besides that you also have this other bearish order block right here. And outside of that, this is technically also just a gigantic order block. I'm not going to draw that out though. Just understand that at the very moment, because we already have change in state of delivery right here, this is a change in state and delivery. You are pretty much clear for upside, at least from the one hourly perspective. Daily chart is also pointing towards the upside. Good news is that the one hourly chart is also pointing towards the upside. So it's very likely that today is going to be a long day. And the reason why I mentioned those two time frames is because the system that I'm trading here requires time frame alignment, which means that I'm only going to jump into trades as long as the three time frames that I'm looking at are aligned with each other. Meaning if I'm going to take a long on the five minute, I want the one hourly to also be pointing up and I want the daily chart to also be pointing up. And today seems like that is going to be the case. At the very least the one hourly and the daily is going to point up. At some point during the day the five minute is also going to point up. So no stress there. While this may be the level that we are going to be looking for, there is also a potential where price could just straight up pump from here on out. And the reason I mentioned that is because the Asia low has already been swept prior to the London Session like as the London session is opening up now we have gotten a pretty explosive move. In fact I even had a limit order like around. Yeah, I actually had a limit order over here that has yet to be filled because you know I was thinking about a long trade already. Yeah, like there is also the potential where like let me just give you, let me just paint you the picture first. This is a potential AMD where you get Asia is the accumulation, right? London manipulates. It's basically like the false move to trick everyone into thinking that the market is going lower. In fact the market's going higher again pointed out by the 1 hourly chart and the daily chart. A lot of the times people do ask me like how do you not get confused right? Because various different time frames are going to be pointing in different directions. So how do you not get confused? The trick is to keep the higher time frame as your guide. Like obviously respect the higher time frames a little bit more than lower time frames and you're going to be good. In this case the one hour one is pointing up, the daily is pointing up. So even though this is manipulation we can see it as. Or rather I am able to tell that it's manipulation because I'm following the higher time frames. This is very likely going to ABN AMD. Although because we have news today at 8:30 we may have the potential of a second manipulation before price actually starts heading towards the upside. But either way like following the system like I could make a short call but again like my system states that I need time frame alignment in order to be, in order to take any trades basically and in this case time frame alignment is basically it's pointing towards the upside. So I'm personally not going to be looking to take any shorts and already I have reason to believe that this could be an AMD. Again another possible manipulation first before distribution. But overall after you have swept out the Asia low you have also swept or rather gotten a change in state of the living. So let me just add that in this now becomes your new order block that when price retraces into you can already see like as price returns back into this order block right here, right for a short five minute candle boom, you're already starting to pop towards the upside. And so this is the power of just understanding smart money trading and the trading methodology is of like I'm not saying that I'm able to read exactly what the smart money is trying to do. If I could do that I'd be like let's just say that I would also be a part of smart money at that point. But there, there tends to be clues and footprints that these big players leave behind and concepts that are proven to work time and time again. And if you'd like my help to implement these processes and this system for yourself, and when I say my help, I mean me and you. I'm going to work with you one on one to install the system that you have been seeing throughout all of these videos that have allowed me to achieve 90 wins in the last 111 videos. Then feel free to click the first link in the description box below and book a call for boot camp. But otherwise, like so far, the trade for today is going to be pretty straightforward. If you eventually get a retracement back into here, that's going to be a trade. If you sweep out this low and you get five minute changes to delivery towards the outside, that's going to be the second trade idea. And let's just look real quick at potential. Yeah, again potential invalidations don't really exist because like the one hourly time frame is pointing towards the upside, daily chart is pointing towards the upside. And so I'm not going to be looking for shorts in the first place. But the invalidation for this idea would be if you get a one hourly candle close below 114, like 114,000, that would be a, again a bearish continuation. So it's continuation of bearish order flow. And if you retrace back into that block right there, depending on what system you're using, very likely you're not going to be using the same system as I am. Then once you get down into here, that's the trade that you would take me personally. Again, I'm not going to be looking for shorts. If anything, I'm only looking for longs. Otherwise I'll see you guys in the next one. Bye bye.










