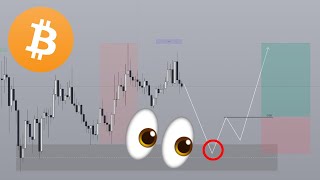
Bitcoin swing traders should load long positions on retracements into order-block zones, waiting for a candle close above the 1-hour level before entering on bullish 5-minute order flow. Two scenarios play out: direct retrace into the bullish block or a sweep of Asia lows before reversal. Targets range from 120k to 125k, with an ambitious 130k.
Questions this video answers
June 26, 2025.
80%.
107,850 (candle close above this level on the 1-hour chart).
At least $120,000–$125,000; an ambitious target around $130,000.
2R (take-profit target of 2 times risk).
Chapters
What's good everyone? Welcome back to another video. The trade from yesterday played out so beautifully that, you know, the thumbnail just ended up being the exact trade. So thumbnail and boom, easy precision. Like 30 minutes after I recorded a video, bam, boom, easy. Although the only thing that I, you know, predicted a little bit wrongly yesterday was that I kind of anticipated the move to happen during news, or at least close to News, which was 10:00am the target was actually hit before even 10:00am but overall, to those of you guys who are new here, just understand that you're probably in the right place because I tend to be right more often than I'm wrong. And if you would like to learn the exact system that I've used to achieve an 80% win rate on my last 90 YouTube videos, then feel free to click the first link in the description box below. But otherwise, let's get into the video. Taking a look at the daily chart. The daily candle closed bullish. I did already mention that this previous, you know, bearish order block that we were looking at would very likely be invalidated. And so, yeah, from this point onwards it is just going to be going long. And so this becomes a potential kind of like imbalance that we can look for price to retrace back into in order to go for a long and over here as well. Although let's not jump the gun because we are trading intraday, we are trading on a five minute. And so while it may be nice that these things happen, like it's probably not going to be relevant for today. And the reason for that is because Lady Candle's bullish. And right now we're going to be looking to trade bullish. But for the swing traders out there, just understand that this is a liquidity sweep followed by a change, immediate change in order flow. So this is your change in state of delivery right here. And so when you retrace into this area right here, there's going to be very high probability for you to get into a swing trade. Just understand that overall, overall you are still very bullish. And as I've mentioned before, price can literally do anything between this zone right here and this zone right here. And in the grand scheme of things, it would just be a retracement. This is your low, this is your high, that's your low. And ultimately, like we are expecting bitcoin to form a new high. This comes also now that I'm thinking of this. Like if you take a look at DXY seasonality, this is the US dollar index. Not sure if I can zoom into this. But anyways, just observe that from June to August actually till basically October, the DXY tends to go down. Now for those of you who are new to crypto or you don't know the correlation between Bitcoin and the dxy, just understand that because Bitcoin is denominated against the USD. And I'm really going to be simplifying things here. If the USD is going up, it means Bitcoin's going to go down. Right? Because this is, this is the relationship that they share. But if DXY goes down, bitcoin goes up. And you know, just looking at seasonality, of course this is from the past 30 years since 2016. So this is not the latest news but just, you know, this is also just one factor but still something to consider is that summer, you know, if the XY starts heading down, which makes sense, everyone's, you know, going for this summer vacation, there is a chance that this gives bitcoin the needed tailwind in order to continue making a new high. Essentially this is just a roundabout way of saying that, you know, I don't think that bitcoin's going to go much lower than this right now. Even though we're playing it day to day on a swing trade basis, I am still very much long. So hopefully that gives an update for anyone who is doing swing trading. And if you are, then this zone right here is going to be a very interesting zone to watch. If you retrace back into here or here, either one is valid, then this is where you load up on your swing positions. Place your stop underneath here and you're going to target way beyond, you know, the current all time high. We just draw a standard deviation expansion. You're looking at at least 120,000 to $125,000. Bitcoin as kind of like a measured move. And if you are feeling a little bit more ambitious like 130, but like yeah, 125 is definitely a very reasonable target for bitcoin to aim for. Anyways, going back into the trade for today again we're in intraday channel taking now that we understand that the daily bias is towards the upside, it' time to narrow it down to the lower time frames so that well we actually have something to do today. So starting things off from what we can observe on the morning Audi chart we are most definitely bullish like in terms of order flow and this at the moment. Now I'm recording this video a little bit early to give you guys some time to react. But Essentially this from the high to the low of this candle right here, in terms of the candle body, this is known as an order block. Or at least in this case, this is a potential order block. It is not going to be validated until you get a candle close above the Exact level is107,850 until you get a proper candle close above this level on the one hourly chart. Right? Okay, one hourly chart, candle close above this level. Only then do you start looking for a retracement into this to, you know, validate this as the order block and for price to, you know, go for a continuation. Until that happens though, I'm just, you know, giving you the scenario as to what I'm looking for. So not only is this candle or like this one right here going to act as the order block, but you also have this one right here. Now this is formed during the Asia session. If you zoom in to the 15 minute chart, you'll be able to see that, you know, this pairs in well with the Asian session. Now the second thing that will kind of align with, you know, this potential order block right here is going to be this smaller one right here. And that's going to be the one we are looking for a reaction for for today. Now granted, news is going to happen today at 8:30am and so look for volatility to either enter the markets slightly before then or after the news has kind of like printed. And so the scenario that I'm looking for today, the first one, after you get a candle close, you can return back into this order block right here. You could potentially take an entry stop and then target for 2R. If you get a five minute, you know, just confirmation in order flow that the market is indeed heading up to that direction. And by the way, that confirmation is simply just looking at order flow. Essentially, once price broke above this one right here, this is now your bullish order block. And as long as you continue to form a new high, meaning you take out this high, it means that this order block here is respected. All you need to understand in terms of order flow is that bullish order flow simply means that price is respecting bullish PDOAs like Orderbox and forbidden gaps. And if you are in bearish order flow, then you are respecting the bearish PDOAs. All you want to look for is after, you know, around 7:30 to 8:30 or perhaps even 9:30, you just want to look for price to have broken up above here, came back into here, and then on the five minute, you just want to See bullish order flow and you can take an entry stop and take 2R. So that's kind of how it would play out. Now the second scenario is that because there is news, I wouldn't be surprised if you were to sweep out this low first before heading towards the upside. This is going to be very similar in terms of a setup to a couple days ago where you got a fever gap right here. This was on the one hourly chart, right? I know this is on the 15 minute chart, you won't see it. But at that video, this is exactly what I called. So this was a one hourly FE gap and then initially you got a sweep above the Asia highs, but eventually you did get a sweep of the Asia lows and then you fill in that favorite gap at the same time. So this was your manipulation move that tricked everyone into thinking that, oh, you know, the market's going to go down. But in reality it was only going down to fill in this further gap right here and to trick everyone into thinking that it's going down. And so once the market reverses, everyone who went short here, you know, shorting the breakdown, or maybe they would have put, you know, stop the break even or maybe they got stopped out or whatever, then it would be too late for them to catch the true move that the market was going to make. And today don't be surprised if you get something like that happening. So first of all, that is a low. This is also a low. This is a low and that is also a low. Essentially you have two sets of relatively equal lows right underneath the Asia lows. I would not be surprised if you sweep out both of these lows and then you fill in this daily favorite gap that exists underneath the Asia low and then you start heading towards the upside. So that's going to be scenario number two. Closer to 8:30am if you get a sweep of the Asia low, which is specifically at 100-705-0 or actually if you look at the relatively equal lows, it's going to be at 107 flat. Then look for a sweep. The moment price starts showing a five minute change in set of delivery or just bullish order flow, then you're going to be taking an entry, stop targeting 2R and that's going to be an easy trade. Either way, for today, the direction is going to be towards the upside. I don't see any reason why we would be shorting here yet. Everything from the one hourly chart is pointing up. The daily chart is pointing up. The weekly may not be pointing up, but that's a bit too far out. And then now the five minute is. Yeah, we're just waiting for five minute confirmation to also point up and then. Yeah, it's going to be pretty straightforward. Anyways, if you watch until this point on the video so far and you enjoyed it, drop a like and subscribe if you are interested to see more analyses from the smart money perspective on crypto. Until then, I'll see you guys in the next one. Ciao, ciao.










