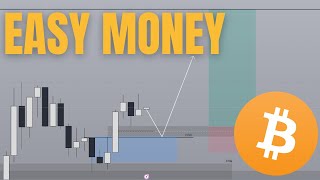
Bitcoin analysis for July 3, 2025 with two intraday scenarios: either a retrace to 108,950-109,000 then rally to 110,650-110,700, or immediate continuation if hourly closes above 109,400. The presenter claims an 82.6% historical win rate and flags 8:30am and 10:00am news as volatility triggers.
Chapters
What's up guys? Welcome back to another video. Yesterday ended up being a super solid win where you retraced back into the CISD and ultimately you not only gave a 2R so your first setup is.
Going to be right here, taking advantage.
Of this bullish order block that has.
Just formed as of the time that.
I'm recording this video.
The moment Price closed above this block right here means that at any point, look for this to happen sometime within.
The next hour to 2. Because, well, at the moment I'm recording.
This video at 6:20am meaning anytime between 7:30 to 8am you should get a retracement either into this block or a little bit below this block. And then 8:15am you are going to, you know, continue towards the upside targeting.
This level right here. But you also went all the way to the intraday target at108,800 and I've seen the comment section. A lot of you did make really good money out of this. And to all of you who continue to leave comments on every single video, just know that I read every single one of them. In fact, I do reply to almost every single one of them and thank you so much for your continued support. But anyways, in this video we're going to try to replicate what we did yesterday and hopefully come up with a good play for the day. And one thing that I will kind of establish right off the fact is that today is probably going to be the last good trading day for the rest of this week. Primarily because you are not going to have any sort of news later on in Friday. As you can see, tomorrow is going to be dead empty in terms of news. And the reason why this is important is because news allows us to predict volatility. It is basically the same exact method that I used to predict that hey, Price is going to retrace up and then go straight down and it happened exactly at news. And the rest of the day is also, you know, pretty choppy. And essentially the way that I always like to explain it is that when it comes to trading, there are always three variables that you're dealing with. One is direction, right? Is it going to go up or down? I'm going to get into that one in just a bit. How far up is it going to go down? How far low is it going to go down? So for example, yesterday I gave you, okay, first of all, you're going to go up and then you're going to go up from here and then you're going to go to 108800. Now, eventually price did go further than that, but still that was the first two variables kind of solved. And yesterday the other thing that we look for is 8:15am Right? That is the news essentially. That is going to be when it happens. And trading is often very difficult when you have to deal with all three of the variables at the same time. But if you can narrow down or even just remove one of those variables outright, then your trading becomes much easier. For example, you actually retrace fully into that CISD zone starting at 8:15. And then just about half an hour later, maybe 15 minutes later, you started going in the direction that, you know, we were kind of predicting. Eventually you did see that order flow confirmation come in on the five minute chart. Let's take a look over there. So this is your change of state of delivery. Price goes up and then comes down. If you guys remember, I actually gave you guys the exact, you know, kind of scenario that you should look for. And this is it. Price goes up, retraces, boom, all the way to the upside, stop loss here. This would have given you a 2R. And of course like the maximum yesterday, if you actually set it to 108, 800 would have been kind of like a 4 or 5R trade. Although I do remember someone out there actually made eight Rs out of the trade idea yesterday. But also, if you have been watching these videos for a while and you have seen firsthand how often that we are right and how much pinpoint accuracy that we're able to determine when and what moves are going to happen, you get a chance to learn the system for yourself if you click the first link in the description box below to book a call for boot camp. Now I'm not going to promise that you will also get an 80% win rate, but what I can promise you is that this system is going to help you become much more consistent as a trader. If you're interested, check it out. If you're not, we move on with the video. So anyways, starting things off on the daily chart, we have a bullish daily bias because yesterday's candle closed. Bullish. And so today we look for more bullish movement. Now one thing to keep in mind is that at the moment we do have a F gap level that is being formed on the daily chart at the moment as well as a bullish order block. First things first, I'm going to draw out the F gap, which starts from at the very moment 108500 all the way down to 107500. So it's a $1,000 F gap that also lines up with this bullish order block right here. This is a bullish order block because yesterday's candle closed above these two down close candles, which marks now this area as potential support. So if you were to come into this F gap, it also aligns with the bullish order block. And if you guys remember the start of this week, I said that the first couple of days of the week are going to go down and then Wednesday you're going to get a pump. The reason I was able to also predict that is because of the weekly order block, right? That's the weekly bullish order block. Essentially we understand that because last week closed bullish, this week we are also expecting bullish. But just because you are bullish doesn't mean that you're not going to get first a false move before the true move shows itself. This concept is known as the power of three. Similarly for you can apply this for the daily chart, the four hourly chart, the one hourly chart, even a one minute chart. Essentially, if you are bullish for the candle, the opportunity for you is actually to look for a buy low opportunity, right? To look for price to actually head lower so that you can buy low and then sell high. This is known as power of 3. I applied this on the weekly chart and then I further went along to apply it on the daily chart as well. But before I get into the daily chart and like what's going on today, it's important to first understand that, hey, on a larger timescale, you are bullish, right? Nothing changes until like $75,000 gets broken. But even without $75,000, as long as you do not get a weekly candle close below $101,000, you are all good. Like bullishness is intact. So for the swing traders out there, just understand that right now things are still looking bullish. In fact, I did mention before that for the swing traders out there, this would have been your entry, right? Essentially coming back into that weekly order block would have given you the perfect opportunity to jump in with a stop loss underneath $98,000. But anyways, now that the swing trading segment is done, let's actually move on to the kind of like intraday situation. So yesterday we got a bullish candle close above here. We've already identified that this is going to be potential support today because the bullish bias is, well, sorry, the daily bias is bullish. We are looking for price, or rather we would be looking for a sell low opportunity, which at the moment, based on what price is currently showing us, it seems to be going to the upside still. But we're going to break it down once we hop onto the lower time frames. And of course from the daily chart we can see that we are pretty close to this liquidity level right here. In fact, you could even say that this liquidity level is this liquidity level because these are relatively equal highs. And for those of you who have again watched this channel so far, you know that relatively equal lows tend to act as a magnet for liquidity. It is also the same reason why I was able to predict that price starting the week is going to go down first. It is because you have 1, 2, 3, 4, 5, 6, 7 relatively equal lows that just prime liquidity, right? Everyone in your mother is going to set this stop loss underneath that level. The reason for that is because, well, retail traders tend to look at this level and be like, oh yeah, because price actually came back to this level and it did not breach the level. So this is quote unquote, strong support. And so everyone and their mom is going to put their stop loss here. Heck, they're going to take a trade from there. And you also have retail traders out there who are like, oh, support level got broken. It's time to short the breakdown, right? Essentially selling low, buying high. When you get an upside, like when you get a breakout to the upside, you're like, oh yeah, you know, we got a breakout, we're going to buy high. I would say to those people that it doesn't take a genius to understand that the way to make money in the markets would generally be to buy low and sell high and not really the opposite way around. So try not to do that. But anyways, again, relative equal lows. And right now with these relatively equal highs, it means that a lot of people are actually eyeing this level. In fact, there must be a lot of stop losses above here. Like people that have went short at any point from $110,000 who have yet to take their profit. I have no idea why they haven't taken their profit. Especially now that price is very close to this level. It is going to be just a matter of time until this level is taken out. And yes, of course that includes the current all time high at $112,000. It is only a matter of time until this gets taken out. A lot of people tend to say that summers are, you know, kind of a lull in the market and you know, nothing really happens. But this changes once we take a look at DXY seasonality. Because once you actually, you know, dive into the charts, you will realize that the dxy, which is the chart that bitcoin is inversely correlated to, tends to go down. Right. If you see starting from June, that's where you find a high. In July you start dipping. In August you give a little pump. But throughout September and October you start going down. And the reason I bring up this chart is because, well, bitcoin is correlated against the USD. This is going to be very oversimplified, but the general understanding is that if USD goes up, Bitcoin goes down. Because these two charts are has an inverse correlation to each other. And if USD goes down, then bitcoin goes up. Well, guess what USD is going to do in July, August and October. At least based on the price data that we have from 1995 versus 1996, there's 1996 to 2016. This is what bitcoin generally does. Doesn't mean that it will 100% happen. History doesn't repeat, but it does often rhyme. Anyways, not going to make too long of a prediction. Back to the premise of the video that we were talking about here. Let's hop into the one hourly chart to see what is going on. In terms of the one hourly chart, we can see that price has actually already filled in this one hourly fair value gap right there and started bouncing. Now in terms of the one hourly chart, you are indeed still in bullish order flow. But here, in case you wanted to look for a confirmed kind of like cisd, this would be it. Now ideally a break above this level right here at 109600 would be the undeniable CISD. So if this happens, this is where you kind of look for an entry. But even right now as it stands, you can look for an entry when it price retraces back to 108950. Or depending on the chart that you're looking at could just be 109,000. This also marks kind of like a bullish order block, right? So that is bullish order block and boom. Once price retrace here, you know, you would take your profit sometime around, you know, 110 700. Again everything is aligning towards the upside. This is. If you guys watch any of my videos, you know that I tend to be very patient and I'm very selective about the trades that I do take. One of the core conditions that I look for when it comes to a day that is worth trading is that all the time frames have to be aligned Together in the sense that the daily chart has to be pointed towards the upside, the weekly pointing towards the upside, the one hourly pointing towards the upside, and even the five minute. And this is one of the days where you have a bullish daily bias. The weekly is up, like even the one hourly is up at the moment. And so that is currently where we stand on the one hourly chart. Although I also would not be surprised if you came to take down this low prior to pumping, basically. Now let's take one more look at what time is the news because this is again very important. We can always figure out what price is going to do, but it doesn't really matter if you cannot predict like when is it going to happen? Because we all know that one guy in the sauna in your local gym that says, oh yeah, you know, the recession's going to come, you know, everyone's going to go broke, you know, the stock market's going to crash and you always have a guy like that who's been saying the same thing for like 10 years straight. And yes, the only thing that you can say about this is that, hey, a broken clock is still going to be right twice a day. And the reason why they are wrong so often is because they don't consider timing right. Eventually, I'm sure there will be a recession. I'm sure there will be banks going bankrupt or whatever. But you also have to be relatively close in terms of your timing prediction. And that's what news allows us to do. So today at 8:30am and 10am we're going to have news and so expect those like in between 8:30 to 10:00am for volatility to really start picking up. And so with that in mind, now we can start to shape our, you know, lower timeframe play for the day, going onto the lower time frame immediately. What I can see is that London has broken out of Asia and so far it is holding like most of the price action of London has actually held above the Asia high. And that's a really good sign. It looks like today is going to be a typical kind of ABC setup. Now don't try to search this up on YouTube. I haven't really seen anyone talk about ABC. It's just kind of a abbreviation that I came up with to simplify the explanation. Essentially, we all understand that Asia tends to be accumulation most of the time. Now London, contrary to popular belief, is not always manipulation. Most of the time it tends to be manipulation and in New York tends to be distribution. But sometimes you do get Asia accumulation. London you break out and you retrace and in New York you continue. Wait. That is the exact same setup from yesterday where London broke out. Most of the price action from London actually traded above Asia. That's a really good sign. That kind of confirms to you that it's going to be a potential ABC setup. It's also how yesterday I managed to predict that it was going to be an ABC setup. And you see you retrace into that CISD line right there and then boom, off you go on continuation. So today's setup is going to be pretty similar and there are a couple of retracement zones that we're going to want to look for. I'm going to give you kind of two scenarios right off the get go. And as of the time that I'm recording this video, it's about 5:00am New York. And right now, if you retrace all the way back down here, I'm going to give you the exact kind of like area that you want to look for. It's going to be between 109,000, 100 to about 109,000, right? 109. 100 to 109. Well, 109 flat is going to be kind of the area where you're going to sweep out basically all of the liquidity right here. 1, 2. So you're going to sweep out all the liquidity. You're going to retest the Asia high and you're also going to. Let's see if there's a fair bit gap on the one hourly chart. And yes, there is. And that is something that we like to see. The one hourly chart right there you have the fair gap starting at 109-100. You guys are starting to see where like one of the most interesting observations that I've observed as I have continued to trade smart money concepts over, you know, many more years, is that a lot of the things that you may think happens coincidentally in the markets, such as how bitcoin kind of finds a bottom right before some major news about a war somewhere around the world or whatever big news that happens. It's like price just happens to bounce from a really, really perfect area. It's not coincidental. It's also not coincidental that on the five minute chart you get a swing low forming right above the A1 hourly 30 gap. This happens all the time. It's also not a coincidence that you get a weekly bullish order block forming right very close to a daily order block forming very close. Yeah, again, it's I could go on and on about this, but as you guys spend more time in the market, you will come to realize that this is not coincidental. The market moves in a few preset kind of like patterns. And as long as you're able to identify what those potential patterns are, then you're going to have a really good time in the markets. Essentially it becomes less about, you know, skill and becomes more about a game of just memory and pattern recognition. If that is something that you are looking to learn. Again, this is what we do exactly in Bootcamp to allow you to read the markets accurately. Just like what I'm doing in these videos. Not just this one and all of the other videos that currently we're averaging about an 82.6% win rate. But anyways, going back into the video today, this is the fertility gap that we are ideally going to look for. If this gets filled anytime between 7am to 8:30am and then price starts to show a change in order flow, essentially like csd, essentially what you want to look for is like yesterday, if you guys remember I gave you guys the exact condition. This as you can see is pretty bearish order flow. Prices you continue to head down. Eventually you're going to get a bearish order block, right? This is a bearish order block that gets blown through, right? That's what you want to look for. That is known as the changes that you delivery. Essentially you want to look for the point when bearish PDOAs such as bearish order blocks and bearish fiber gaps are no longer respected. And that is when the price reverses. Don't get me wrong, I not saying that once price gets into that level, you just place a limit and you just go from there. That is entering without confirmation. And so if you lose the trade in that fashion, just understand that you are not using this system, right? You're not using this call, right? Once you get into the key area, you still have to wait for price to give you the reaction that you're looking for before you jump in. That is how you ensure that you have a really high win rate. Just to make sure that you're not jumping prematurely into moves that are not confirmed yet. And so let's see if there's anything else we missed. There is also a one hourly order block right there. And that also means that price could have the potential to retrace into this blue box right here. Either way, like starting from 109, 100 to like 108700 is going to be the area that you want to look for price to bounce from essentially, I'm not saying that price will definitely bounce from here, but there is a high likelihood that you're going to get that changes the delivery happening around these areas once it happens. Entry Here, stop there, target 2R or target the level that I've set for you at 110650 or like 110700. And that's going to be kind of scenario number one where you get that retrace and then eventually price goes up. But then there is also a second scenario that is possible which is that from this point onwards, price just straight up goes up.
Right.
And the level that you're going to want to look for is going to be this one right here. The exact condition for this scenario number two to happen is if you get a one hourly close above 109400. Okay. Hourly close above this level signifies that this is now validated as a bullish order block. And when you price returns into this area anytime between again 7am to 8.30am, you're going to want to look for that bullish CSD to happen around here. Once it happens, then boom, take the trade, go higher. It's going to be pretty straightforward. Hopefully that makes sense. And lastly, we also need to talk about kind of an invalidation scenario because not we're traders, at the end of the day, there is no saying that the market could just completely go out of our expectations. And yeah, in case that happens, you also need to know, you know what to do, right? Kind of having a contingency plan. And first of all, the best way that you're going to be able to prevent yourself from being caught up on the wrong side of the equation is to wait for that confirmation. Just price coming into some kind of key level is not enough for you to be jumping in at the markets right away. You really need to see that kind of lower time frame confirmation before you do jump in. So that's the best way that you're going to be able to kind of prevent yourself from getting caught up on the wrong direction. But then it's actually getting to the invalidation scenario. If you do not get any sort of bullish CISD on once Price taps into here, into here, then yeah, chances are you're probably going to get a one hourly close underneath 108600, which is going to be the exact condition where if you get a one hourly close below this area, you can see that now the one hourly will have had a change in state of delivery instead of being bullish order flow you are now switching into bearish order flow and price is going to start going down. Now I do think that this is going to be the lower likelihood scenario just because of how everything at the moment is adding up to and pointing towards the upside and so if we do get a day where we go for a little retracement it's probably going to happen tomorrow instead because there is no news and non news days tend to be a bit more choppy a little bit more manipulate if that is a word and it just tends to have a lot like more shenanigans than usual. But anyways if you've watched until this point so far and if you would like to see more of these analyses done from the smart money perspective on crypto then make sure you subscribe because I'm going to be making a video just like this every single week day. But until then guys I'll see you in the next one. Bye bye.










