Bitcoin closed the week bullish and filled a February gap, setting up for potential gains later this week. Expect early retracement that sweeps Asia and London lows before late-week upside, with confirmation needed on lower timeframes before entering trades.
Chapters
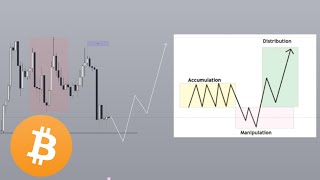
What's up? Bit of an earlier video today primarily because, well, the setup for today is just really clear. Setup for this week is clear as well. And so I'm just going to get right into it now. Last week was a really tough trading week for reasons that I've already discussed throughout last week, which is that there was no news. This week though, very different. We have news on both Tuesday, Wednesday, Thursday and Friday and today is Monday. So most likely today is going to be more of a setup day. Although like, like the setup is already going to be pretty clear. So anyways, kicking things off on the weekly chart, we have a bullish weekly close. That means that Price this week we are anticipating a bullish love week. And this comes after filling in the February gap that we narrowed down last week. And like we did talk about this the entirety of last week. Hey, you're going to fill this in and then you're going to bounce. And so far this has already happened. This is already confirmed, which means this week is going to be a week where we continue to ride the momentum. Now the only thing we need to keep in mind is a retracement could be possible at the start of this week before a late week expansion. Right, that's going to be the call. And for those of you who are new here, just understand that I have been publicly tracking my calls since February and so far we are at about an 80% win rate on these analyses. So if you're new here, just understand that you're probably in the right place because we tend to be right more often than we're wrong. Coming down to the daily chart yesterday also closed bullish. But again, like this is misleading because we can anticipate some kind of a start of the week retracement before price continues heading up. But purely based off of the last daily close, today's daily bias is going to be pretty bullish. Going down to the 1 hourly chart. I'm just going to remove what's on here because I posted this to the Discord earlier today, which this didn't end up getting filled by the way, so no trade anyways. Just remove that so that we have a clean chart to work with. A couple of things to keep in mind. Because we have a bullish daily bias, that means that a retracement into either one of these zones are going to be just interesting for us to get into again either one. And this is going to be become much more evident the moment I go down into the 15 minute chart or you know, just a Lower time frames. So there are two ways that things can play out today. One is it seems that Asia is at the moment heading towards the downside. Now again, I'm recording this video quite literally six hours earlier than usual. What you can look for is for London session to potentially come down to this low right here, take out the low and then potentially show signs of reversal towards the upside. Which means today is either going to be an AMD kind of setup, right? Accumulation, manipulation, make everyone think that price is going to hit towards the downside and then distribution towards the upside. Or it could be an abc. These are usually the two ways that markets tend to play out. This is a London, you want to see a breakup above Asia, retrace back into the low, or rather you do not want to see it break below the midpoint of Asia and then price to start heading towards the upside. That's going to be the second scenario. But either way, I am looking for longs today, primarily because yesterday's daily bias is bullish. And you know, yeah, we're just going to be bullish heading into the rest of the week. The only thing we need to figure out we're definitely going to sweep Asia low, but if we sweep Asia low, it's very likely that we're going to sweep this low as well. Primarily because these are going to be relatively equal lows. And when it comes to relative to equal lows, they tend to be a magnet for liquidity. Right? So expect that to get swept. Now, the specific like confirmation that you want to look for when it comes to a long is something like this, where this is your bearish order block right here, for example. Right. That's your bearish order block or potentially even. This is your bearish order block right here. What you want to look for is for price to reject the bearish order block. Right? Basically break through it, come back down to retrace it, flip potential resistance into support and then that's going to be your entry. Boom, boom, boom. Now, of course this is not the time to be taking it right now because we are almost at the end of the Asia session and ideally you want to do this during the London. And the reason why I mentioned this was because once you come down to this double right here, it's going to look like prices in bearish order flow. Right? Bearish order flow is when bearish order blocks are being re respected and bullish order flow is the exact opposite of that. So you only want to enter. I can give you the zones that you want to look for. I can tell you the direction, the general direction of today, but ultimately you need the market to kind of give you that confirmation before you jump into it. Like that's the job of us traders, right? We know what we're looking for, we try to read the market, but then we don't be stubborn and like just try to trade what we want to see. We trade what the market actually is showing us. And in this case, like we have a good, you know, thesis, we have a good bias. It's either one of these two levels right here. Once we get to those levels, we just want to see a five minute change in order flow and then you can get in at any point and target for 2R. Again. Today is not going to be the highest probability trading day because we have no news today. The reason why you want to have news, by the way, is that last week was a really good example of this. When we have no news, there is no volatility. And I'll always explain it like this. In every single trading scenario you have three variables that you're looking for. One is going to be direction, right? Is it going to go up or down? Second, how far up, how far down? And third is timing, right? When is it going to happen? And also kind of like how long will the move last? When will it be over? Will it happen fast or slow and stuff like that, right? All in all, there is a lot of variables that you're dealing with when it comes to trading. And the beautiful thing about news is that it kind of narrows down the variables that you need to keep in mind. Because with news you already know, hey, something's probably going to happen at 10am on Tuesday, right? There's something's going to happen, you just don't know direction. And so it narrows down at least the timing kind of variable so that you can just focus on figuring out, okay, is it going to go up, down, you know, direction and everything. And that's why we want to be trading on Tuesdays. Now last week, if you take a look at the price action from last week, let me just go on to the one hour chart. For the majority of the week, right? Quite literally until Friday we were just ranging around like, yeah, so take a look starting from Saturday, Sunday, okay, let's say Monday, the high of the week was 120k, low of the week was 117k. Right? That was the whole week. And we've just been ranging around. And so last week was a really tough week and hence why from Monday to Friday last week I was just, yeah, you know, this week isn't going to be very high probability and I'm not really going to make any calls or at least I'm going to make less calls because, you know, there are some weeks where like today the direction is very certain and there are other days or entire weeks or potentially even a couple of weeks where it's just not clear. And on those times, just stay away from the markets. Maybe trade some forex, maybe trade some indices, futures or whatever. And the end of the day, like, the more flexibility that you have, like, for example, if you're able to look at multiple asset classes, if one isn't giving you a decent opportunity whatsoever, like, for example, Bitcoin, Bitcoin's not giving you any good opportunities. Heck, look at altcoins. Altcoins not giving you any opportunities. Heck, look at forex. Forex, look at indices. Just know that whatever you are going to learn, like whatever concepts that I talk about in this channel that has allowed me to get a kind of like 80% analysis rate. And again, this is all publicly tracked on Twitter and on YouTube. Like, for example, right now we're about 85 out of one or three of the last one or two videos that we've made or out of one or three calls that we made. Like, whatever you're seeing and learning from these videos, this exact system that I'm using is applicable to every single market out there. As long as there is a candlestick, as long as there is a chant that you can read, it's all going to be applicable. And that's the power of this system. Now if you would like to learn the system for yourself, feel free to check out the first link in the description box below. Now, to those of you that are not interested, no stress. Just make sure you follow me on Twitter at the Art of Crypto because, like, I'm making this video really early today, just testing out a different concept and like, chances are I'm going to be posting updates later throughout the day, not only on bitcoin, but also on Altcoins. Anyways guys, see you in the next one. Bye. Bye.










