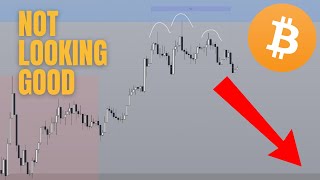
Technical analysis of Bitcoin across multiple timeframes shows weekly uptrend but recent daily structure breakdown suggests bearish order flow. The creator recommends short opportunities between 08:30-09:30 before a 09:45 news event, with invalidation at an hourly close above 102,800.
Questions this video answers
June 23, 2025
71 wins out of the last 85 videos since February
About 5:00 AM (local recording time mentioned)
Around 09:45 (expect volatility around the 09:30–09:45 window)
An hourly candle close above approximately 102,800 (USD)
Chapters
Are we going down? Is the bull run over? Are we about to head all the way back to the 70Ks? Are we about to enter a bear market? That is the questions that some people may be having after the dump that we've seen throughout the weekends. And in this video I'm going to answer that question as well as give you the setup for today because well, we are an intraday channel and I'm always going to give you guys the higher probability play for the day. Now last week I did mention that I was expecting that bearish target to get hit basically and we stopped just shy of it. I don't know if you guys want me to consider that as win or not, let me know in the comment section down below on that play. If you guys indeed, you know, got some wins out of it like you guys let me know. But otherwise we are currently sitting at 71 wins out of the last 85 videos that we've made since February and we're going to look to continue that win streak. But anyways, let's kick things off on the weekly chart. Taking a look at Bitcoin. We are still indeed in an uptrend not only market structure wise but also in terms of order flow. So you can see it's just been higher highs and higher lows. Essentially. As long as this low does not get broken, it means that we are still in an uptrend, at least from a market structure perspective. This entire block here is also known as there's a bullish order block on the weekly chart. And if you take a look at what happened on price beforehand, you had a February gap right there and then you had another one right there as well. The price ended up just retracing to the second favorite gap before going higher. And in this case, can we have a similar setup? In this case we have a further gap right here that we have just recently filled, but we have a lower one right there. Which also means that even if price were to retrace all the way back to that fib gap right there. Yeah, you wouldn't really panic because this is sitting at the 0.6 as well as the 0.705. Also if you were to go into this fairly gap right there, you would be going into the discount zone which is for those of you who are familiar with freem discount theory, that is exactly where you would be looking to buy or at the very least stock up on your long term positions. Now that is on the weekly chart. Just understanding that in the major time frame there is nothing Much to panic. Another thing that is noteworthy is the fact that you have recently, just like this is the February gap, right? But previously you formed a weak low at the February gap right there. A week low is basically a low or high that does not sweep liquidity. If you take a look at the weekly chart, this is not liquidity. This is not. This is not either. Sure. On the daily chart, this is liquidity. And this is indeed a strong low. In fact, if you take a look at the daily chart, we even had a broken base in the sense that. Well, a broken base, that has been invalidated, of course. So after sweeping out the liquidity there, you immediately broke market structure here as well as order flow. Order flow is what's important. You immediately get a strong move to break order flow. And previously my order flow guess, right. My setup, which ended up being wrong, is that once you filled in the. Basically once you retrace back into the broken base, you would continue higher to take out this high as well as this high, which are at this point relatively equal highs. Of course, trading is a probabilities game. I can always make guesses, but I'm never always going to be 100% right. We can all try to make educated guesses, but at the end of the day, we have to accept that that's all it is, right? It's just an educated guess. That aside, at the moment, what do we expect next? So taking a look at the daily chart right now, order flow is clearly bearish. In fact, you have just broke underneath this zone right here, which would mark that as a bearish cisd. And essentially now we're going to be looking for more bearishness until otherwise proven, what needs to be, or rather what is the condition that would prove this otherwise? Well, I. At the very minimum, you want to see price break above this kind of like bearish order block, which kind of what I was talking to you about before last Wednesday, speaking about the fact that it's also. This is also the reason why I predicted that price was going to go down last Wednesday. Because. Because you have broken below, like at this point here, that was your change in state of delivery. That's how I knew that price was going to head lower. The only thing that kind of got us was the fact that we didn't take out the daily target right there. This ended up being an inside bar. So the idea was correct, just market conditions was a little less volatile than we would have wanted. And so that's why that trade got stopped just short of the profit target anyways. Overall, the direction was still heading down and it all started from this change in state of delivery right there. And by the way, if you guys have been watching my videos so far, you understand just how accurate this system is. We're basically right about 80% of the time and even when we're wrong, it's usually not by a huge margin. If you guys would like to learn this system for yourself, feel free to click the first link in the description box below. Don't worry, this is not some online course where I'm just going to give you a bunch of videos and then leave it to yourself. I'm going to be working with you personally, one on one, getting you from where you are to ideally full time trading within the next 90 days. If that sounds like something you might be interested in, click the first link in the description box below. But otherwise we're going to get back into the video. So at the moment we're going to play the daily chart towards the downside as well. Taking a look at the weekly chart last last week's candle would have closed bearish as well. The Internet was fine until I started recording this video. But yeah, see last week's candle closed bearish. And so following the power of three, this is the weekly open. We ideally want to look for the start of the week to trade higher. This would be your manipulation move to form the high of the week before like the true move begins which is going to be towards the downside and the target is going to be of course the current weekly low. Now again I've given you the conditions as to why this might change. But until that changes we are still going to approach this as a opportunities for us to sell basically in a downtrend every opportunity or like every retracement, every pump basically is a retracement to allow you to take a sell opportunity. So at the moment taking a look at the one hourly chart, you are returning it back into this order block right here. If you would like to refine this order block all the way to just that area right there. You also can but doesn't change the fact that you are in a zone of bearish resistance. As of the time that I'm recording this video it is 5am and today we are going to be having some news at specifically 9:45. So expect volatility to pick up around the 9:30am kind of window. But doesn't mean that we still wouldn't have opportunities prior to that point. Taking a look at the one hourly chart, we are still in bearish order flow. And yes, sure you may have gotten a impulse move, but until you break above at least this one, we're going to be leaning towards short. Now of course we're going to be talking about the long scenario in just a bit, but just understanding where we are on a one hourly time frame. Now hopping onto the lower time frames, we are seeing immediately that we're getting some kind of a heads and shoulders formation right here. And in fact this may be prime time to take on a short. Except it is 5am and we're about to exit the kill zone. Anyways. If you break underneath this right now, you can expect the market to head lower because in this case this would be your class classic Asia accumulation, London manipulation right into some kind of higher time frame resistance. And then New York you distribute down to not basically towards the downside. This will be in line with the daily bias as you can see right here. That's a bearish close. And so daily bias, bearish, weekly bias, bearish, one hourly. We are bearish. And on the five minute, well we're about to be bearish. In fact, within the next five minutes if you close underneath this, you will basically get a change in state of delivery ideally by the time you guys watch this video. Just look for this zone right here which is at 101 600,000. Now me or not, just increase the font size of the numbers on the right hand side here so that you guys have an easier time seeing it. Let me know if you would like to see that in the comment section below. Otherwise the setup is pretty clear. More likely than not I'm going to be looking for a short somewhere between the hours of 8:30am to 9:30am basically just an hour or so before news. Now what happens during news? Also just be aware that you could ultimately do one more manipulation move towards the outside. Basically almost doing like a three drives pattern. Let me just show you how that's going to look like. So if you take a look at the one hourly chart right now, that's your first. This is your first impulse up, that's your second impulse up. Now prior to news you may do a third impulse up which will be a false move. You may even sweep out the liquidity over here. But as long as you do not have an one hourly close above this bearish order block right here, which let me just mark it with a different style so you guys can differentiate it. As long as you do not close above 102,800 then you're overall still Bearish. And this will be the final manipulation push up before market structure breaks aggressively and price starts heading lower. So just be warned that as long as you do not get a one hourly candle close above this one hourly order block right here, you are nowhere in the clear. And just look for shorts today. I'm saying this because last week I remember, actually I think two weeks ago I remember very clearly. It was also the same kind of like blueprint where it was 9:30am news or 10:00am news and I was saying like, hey, you know, price is going to head towards the downside. What I did not like, what I failed to tell you guys, was that you may have just one last move up before going down. So if you see this, then just don't be surprised by it. Overall, this move is down until you close above this, in which case you could potentially look for a flip of previous resistance into support. Although ideally I would wait until tomorrow. The reason being is because the weekly bias is pointing down, the daily bias is pointing down one hourly bias. In this case, if you close above here, it would be pointing up and of course the 5 minute will be pointing up. But in this case you're getting two time frames pointing up and two time frames pointing down. And like one of the core tenets that I live by, just kind of like a principle to always be taking quality trades is to always wait for time frame alignment. Basically you want all three time frames, the higher time frame, the lower time frame and your middle time frame to be pointing in the same direction before you start flipping long. And if we wait until tomorrow at least then like for example, if you close above here, then the daily chart is probably going to close bullish. And that means that the day is going to be bullish. Tomorrow the one hourly is going to be bullish. And then so we can just wait for five minutes to also be bullish and boom, we have an A plus trade. So I wouldn't be too impatient today. And overall I'm just thinking that things are going to head towards the downside until animals proven. And if it is, then I'll have a much better idea on what kind of trade to call for you guys tomorrow. But until then, at the very moment, yeah, just look for shorts. Nothing more to it. By the way guys, if you're watching at this point so far, and if you're wondering what happened to the camera currently back home where I'm from and at the very least until the next time we are traveling again, I'm not going to be using a camera unfortunately. So you guys will have to bear watching these videos without my beautiful face on it. But don't worry guys, it's not going to last too long because I already have my next trip planned. But anyways guys, if you enjoyed it, drop a like. If you want to see more of this analysis from the smart money perspective, then subscribe turn on the bell notification. Otherwise, I'll see you guys in the next one. Bye Bye.










