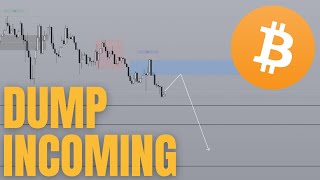
Bitcoin is set up for a short-term dip to 106-107k before continuing higher, according to order-flow analysis. Watch for bearish order blocks and a change in state of delivery around USD news at 9:30am to time intraday short entries while staying bullish on the longer timeframe.
Chapters
What's up, everybody? Welcome back to another video. Yesterday we called that to perfection where you ended up manipulating above these two highs, filling in that higher time frame fabric gap during the New York session. Exactly at 7:15am is when that manipulation happened and you filled in that favorite gap. And then boom, straight down you go, targeting all of these relatively equal lows that I talked about from yesterday. And so overall, this puts us at a very solid win, putting us up to 76 wins out of the last 92 videos that I've made since February. And in this video, I'm going to look to continue this win streak and kicking things off right now on the daily chart. Yesterday's candle closed Bearish, which is exactly the signal that I was looking at yesterday. If you guys remember the video from yesterday. I also mentioned the fact that it would not be surprising if you ended up retracing all the way back down into this weekly OD block first before you continued towards the upside. Now, even though last week's candle closed bullish, and we are going to be bullish on this week again, it wouldn't be surprising if you retraced all the way back down to 107 before you started the true expansion move of the week. And again on the daily chart, it is, you know, also same. This was the first gap that we drew out yesterday. And like Price is at currently probably on route towards this velvety gap or at the very least sweeping out this daily low first before any sort of upside movement. And so today the setup is going to be pretty simple. It is going to be towards the short side. Now, don't get me wrong though, this doesn't mean that, hey, Price is just going to start dumping immediately. It's more like right now you have relatively equal highs, 1, 2, 3 formed right there. And so eventually you will continue to go to the upside. It's just I'm predicting that there will be a retracement first before, before we get more upside. Now, heading into the one hourly chart, you can see that that is still the last relatively equal low that has yet to be swept. And yeah, looking at this, I'm just reminded that, you know, we played yesterday to perfection. I'm sure there were a lot of people that were looking for Price to actually start going up. They might see that, oh, Price filled in this order block right here and then they start going long and then, you know, they eventually get stopped out. And one of the reasons why I was able to see it's largely due to the system that I'm Using that has allowed me to get an 80% win rate on all of these videos that I've since February. And if you would like to learn the system for yourself, feel free to click the first link in the description box below to book a call for boot camp. Now I'm not going to promise that you will also get an 80% win rate, but what I can promise you is that by using the system you're probably going to be much more consistent as a trader. But for those of you who are not interested, back to the video and on the one hour chart at the moment this remains the target for the day. Now you can see that bearish order flow is now already, you know, put into place. And so today is going to be just prime time to take a short at the moment I'm going to draw out this order block right here as a resistance zone that we could touch into which is at 106850 and ultimately target for today is going to be that daily low that I've marked out. And we can also just draw a couple of other lows from the one hour chart to target. But overall I wouldn't be surprised if we hit 106 today basically could go much further than that. And that also depends on whether or not we have news. And today the good news is that we do have red folder news for USD. And the reason why this is so important is because news is this a predictor of volatility? I always like to say that there are always three variables that you're dealing with when it comes to any sort of trading. The first one is direction, right? Is price going to go down? We've already established the fact that today price can go down. Secondly, how far is it going to go? And we've already established that it could be either one of these three levels could even go all the way to the daily fair value gap over there. But essentially that's the second variable that we've kind of predicted and the third one which is oftentimes the hardest but we also have, you know, ways to predict that. And the third variable which is is going to be timing how long is it going to take for this to happen and most importantly when is it going to happen. And news has the benefit of telling you roughly when it's going to start. You know for sure that something's going to happen when the news event drops because it's redfill the news because it's such a major event. You know for a fact that a lot of market participants are going to be eyeing that, you know, timing to make their move. And so that essentially removes one of the variables that you need to figure out. So instead of having to figure out all three variables at the same time, you can kind of narrow it down and just focus on two. And for today, it's going to be pretty straightforward. Once 9:30 hits, just expect there to be something. And the game plan for today is going to be pretty straightforward. Look for Price to give you some kind of volatile move either between 9.30am to even 10am and so now that that's out of the way, it's time to figure out exactly what's going to happen by hopping down into the lower time frames. So right away, we've already established that this is now the resistance in the sense that when Price heads back into this area, that is going to be the area where you look for the high to be formed and then to take a trade somewhere here, maybe stop loss here, and then just targeting those lows over there. And this is also going to play very well into the ABC setup. Now, a lot of you may be familiar with the AMD setup where Asia, you get accumulation, London, you get manipulation, and then New York, you get distribution towards the other side. But sometimes you get an ABC instead. So instead of this being manipulation, London, London actually breaks out. And then sometime between London and New York you're going to retrace and in New York you're going to get continuation of that daily move. And that seems to be the kind of profile that is setting up for today, which is an abc. And so your setup for today is going to be super simple. At the moment, this, on the one hour chart, this blue box is the resistance. Basically like 106, 850 all the way to 107, 100. So ideally you come back into this box before you start heading towards the downside. Now there is also another possibility where if you take a look on the five minute chart at the moment, this entire block is actually the resistance. So starting from 106600, as long as Price retraces into anywhere in this blue box and you start seeing bearish order flow. Bearish order flow, by the way, is very simple. All it simply means is you are seeing bearish order blocks and bearish favorite gaps being respected. So just to give you an idea of what this means, this is a bearish order block right here. Once Price breaks down, Price respects it and starts heading towards the downside, this becomes your new bearish order block right there. Price heads up, breaks down. Essentially, as long as these order blocks are being respected, you can see that order flow is bearish. And essentially, once you kind of start getting into this area right here, technically, some people might look at this and be like, oh, yeah, price is bullish now because you have disrespected this bearish shoulder block. You've disrespected the shoulder block, and, you know, you could potentially start looking for a higher low here. So some people might think that this is bullish, and they are. Right, Right. Strictly speaking, from an order flow perspective, if you were to retrace all the way back to 106, 850, you would technically be in bullish order flow. Right. Just very minor, like, very basic bullish order flow. But overall still, you know, it's going to be weak. Bullish order flow, but still bullish order flow. And so what you want to look for is the price to start breaking lower for a bearish order block to form, and then price coming into the order block and forming a new low, essentially, bearish order flow. Now, the official term for this is called cisd or otherwise known as a change in state of delivery. And that's exactly what you want to look for once you get into the timing. And speaking about timing, what timing should you be looking at? So we know that news happens roughly around, like, the news event is going to be dropping at 9:30am as well as 10:00am like, it doesn't mean that the retracement will only happen at that time, and then, you know, everything's gonna happen after that timing. The. As long as you are within the 7am to 10am window, basically starting from 7am if you start retracing, as long as you start getting that breakdown and that change in order flow between these three hours, you're like, you're gonna be good. Now there is a chance that Price could actually give you a final little, you know, manipulation. Move to the upside. Basically tricking everyone into thinking that, you know, price is indeed going towards the upside, when in reality it's just manipulation before, you know, giving a swift dump. And this is something that we managed to anticipate last week, actually. So I'm going to give you. Let's take a look at when this happened. So, yeah, right there. If you guys remember last week, one of the setups that I gave you was that, hey, this is a higher frame resistance right here. And this is Asia, this is London. So you're going to get manipulation. But on this day, at 9:30am exactly 9:30am you had news and one of the scenarios that I gave you guys was hey, you may get a three drives pattern, just one final push up. Even though this is a bearish order block, right? This is from the London a bearish order block. Now even though that is the case there is still a potential for price because it's a newsday to sweep out the highs before giving you that downside move. And eventually that is what happened. And this is also the reason why you really want to make sure that you're entering after only after you get the lower time frame confirmations which is changes that delivery. Once that happens it's never too late. Entry here you can place your stop there. This is going to be an easy 2R opportunity. Even if you place your entry and stop loss based on the 5 minute chart. Based on that, you know change in order flow, let's say that's your new order block stop 2R it's going to be pretty straightforward anyways. Hopefully this gives you a good idea as to what to expect heading into the rest of the day. Just remember that on the higher time frame you are still very bullish. Whatever I'm talking about in this video is purely intraday. This is not going to be relevant for a swing trader. For a swing trader you are looking good at the moment. You're just retracing. This is the area where you would ideally look to load up heavily on your bitcoin positions or altcoin positions before the next leg towards the upside happens. For now we're still playing this retracement move and if you watch until this point in the video so far, drop a like and subscribe if you would like to see more of these analyses done from the smart money perspective on crypto. Otherwise, see you in the next one. Bye bye.










