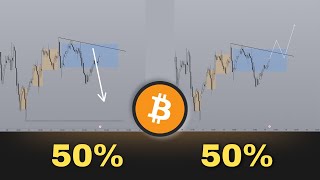
Bitcoin technical analysis using market-maker sell models. A bearish setup targets 4.7R with a deeper 6.4R dump possible, but bullish invalidation comes if price sweeps relative highs and closes above the CISD block. The speaker's tracked calls show a 74% win rate over 39 trades since early February.
Chapters
What's up, guys? So the market maker sell model yesterday ended up playing out where we started breaking below. And now we have confirmed a change in the state of delivery. So today is going to be quite literally make or die for bitcoin in the sense that if you are bullish, you want to see a break above the CISD block. If not, then you are going to continue down back to the original consolidation. But those of you who might be confused as to what I'm talking about in terms of a market maker sell model, this is how it looks like. You have an original consolidation accumulation, second leg up into some kind of higher time frame liquidity or point of interest. And then you go back down to the original consolidation. In terms of this, you have your original consolidation first leg up, second leg up into a higher time frame liquidity. In this case, this is a daily bullish, sorry, daily bearish velvety gap right here. That's your higher time frame key level. And the last time that this happened, like this is not the first time it's happened. In fact, the last time it happened was last week where you had a, a one hourly favorite gap over here. And then Price did original consolidation, first leg, second leg, eventually third leg, and eventually retrace all the way back to the original consolidation and more. So am I saying that this time around is going to be the same situation again? Oh, and also before Price actually went back down to the original consolidation, you had a change in the state of delivery, which I'm going to mark out with the blue box here. Once it breaks down, retraces back into it and off you go. At the moment, also broken down below it right now, you're retracing back towards it. As of the time that I'm recording this video, it hasn't started dumping yet. However, am I saying right now that bitcoin is absolutely just going to start dumping? Well, I'm not going to say absolutely because there is no such thing as 100% when it comes to trading. But I would say that the probability that we go down from here can be a bit higher compared to the upside. But I will also give you a scenario that if confirmed, you can expect some kind of bullishness. So let's get into it real quick. This is your changes state of delivery and if you mark out your changes state of Delivery with a 0.5 fib, you can see that we are currently retracing back to it. Now this is a good sign if you are trying to take a short, which means that as of the moment right here, right now, you can already take a short placing a stop loss above the bullish, sorry the bearish CIC block and targeting again the original consolidation which would be all the way down here giving you a 4.7 R trade. So already this is a valid setup. Now could will be a possibility that bitcoin continues heading lower, like even further. Absolutely. You know that there is always a possibility. In this case we're looking at a 10% dump all the way back down to that further gap right there from the daily chart, which I am sure if we go up to the weekly chart it will add up, it will line up with something and in this case it will just be the weekly end of the weekly 30 gap rather. And we can also draw out a 50% line of this to potentially have another target. So basically this will bring this to a potential of 6.4 R. Not saying that this is going to happen though, which is why now I'm going to give you a scenario to where this may confirm bullishness. Because in terms of the macro, we are indeed bullish. The fact that we are currently inside a weekly further gap right now. In fact, if we take a look at the weekly chart right now, we are without a doubt bullish. Heck, we have been bullish since technically 2020. If you want to read market structure like this, I know this is not applicable to whatever we're trading right now. So let's look at it for a min. Little bit more short term, right? Just this cycle, if you take a look at market structure, you can kind of draw it like in this way, which essentially means that price can literally go up, down, inside out, top, right, left, inside, whatever, as long as it doesn't break this low here at $48,000 you are overall still in a bull market. And the fact that you are currently in a weekly favorite gap right now means that this is a bullish sign. This is essentially just this before this, right? Just a retracement before this and it's going to come. We have not had any sort of a, I don't want to say blow off top because every cycle is going to be different. In fact, this cycle around it is so different from the other cycles to where a lot of the strategies that used to work in the past are now no longer working. So if there is one cycle that is very different from everything else, it's going to be this one. But even then there is still no signs that hey, you have greed, you have euphoria, altcoins haven't pumped. And as well as a lot of macro factors such as the M2 money supply, you have the fear and greed index showing all time highs in terms of fear. You have people, you have quite literally the largest long liquidation in history that just got confirmed. Like there are so many macro indicators right now that are showing that, hey, you know, things are bullish. For example, if we take a look at this RSI Bollinger band percentage, then right now this was the cycle top which was the previous all time high. The last time this happened was also a previous all time high. Check it out right there. And then the RSI Bollinger band actually went all the way down to quote, unquote oversold. And this is where we are right now. And guess what happens after that? Boom. Well, we can only assume that's going to boom, right? This is just one of them. We can look at, you know, short liquidations. We have 1.5 billion that of short liquidations. If we were to return to $90,000, the bull run. This is the M2 money supply. Once this signal prints, then, you know, the last two times it printed was the catalyst to kickstarting the bull run. And it makes sense. You need global liquidity, you need money in the market for prices to pump and people need to have excess, you know, income in order to, you know, put it into speculative assets like crypto, like stocks and stuff like that. Currently it's already been about 60 days since the M2 money supply started going back up again. And this is usually a really great sign that, hey, you know, things are about to change. I'm going to take a moment also just realize I've got to do this at the start of the video. But so far, since I have started tracking my public calls at the start of February, we have been 29 out of 39 with a 74% win rate. Now the reason I do this is to just establish some credit ability that, hey, you know, I am right more often than I'm not not saying I'm going to be 100%, but at least if you do decide to watch me, there is a good reason why you can watch me and believe the things that I'm saying. The way that I'm determining whether or not these calls play out is if the target gets hit or not. And overall 29 or 39 not too bad. And like, yeah, check it out, that's the global M2 supply. Like there are many instances. Like for example, eth right now is, you know, just at the lows and it's looking pretty good. And overall like crypto is just not at a point in the terms of the macro where we need to stress about it. Right now Bitcoin, we're just playing it day by day. So now let's move on to that lower time frame structure or like that lower time frame bullish setup that I was talking about that could invalidate this short. So right now the short is valid. Although personally I am not just taking a limit right here right now because I also want to see signs in terms of the lower time frame. I am more of a lower time frame trader to where I can confirm that the move is going downloads. It's going to be way too much to talk about in this video. So I will give you guys just if you guys were to take this trade, then it will be just a limit here if we stop here, but make sure you manage your risk. Now the only thing that makes me concerned about the short trade and why I am not jumping in yet personally and why I want to confirm things on the lower time frame is because you have relatively equal highs over here. And for those of you that know anything about relatively equal highs is that they act as a draw on liquidity. Price is always attracted to these levels because retail traders are going to look at this level and be like, whoa, this is really strong resistance. The last six times that price came to this level, price got rejected and price failed to break above it. So guess what, I'm going to place my stop loss here. And for every one person that thinks that there are 10 or even 100 other people that are thinking the same thing, the market makers know this very well. They know that there is a lot of liquidity above these levels. And of course underneath relative equal lows as well. Right now, price is just sort of consolidating. So all I'm trying to say here is that price I think will sweep out this level before any kind of downside which will invalidate the market maker sell model. And potentially even if you get a bullish candle close above this CISD block here, you get a one hourly candle close above here. That would in fact invalidate this bearish idea. So the bullish idea in this case is probably going to be you sweep out the highs, you come back down, right? People are going to also look at this, be like, oh, you know, it's some kind of breakout, because if I draw a trend line right now, you're going to see what I mean. So most likely a quote unquote breakout to where you can Actually like fade that back into the range into some kind of key level before upside. So that would be the bullish scenario if you get a kind of close above the CISD as well. But I do think that is a very, very likely scenario just given how price action is currently shaping up so far. Now again, me, I just want to stress this again. If I'm taking a short, I am picking it from the lower time frames, not on this time frame. Because as it stands right now, yes, we have a one hourly cisd, but until I also get just a CISD again with break below, let's say this block here, then that will give me the confidence I need to just start shorting this all the way to zero. Until that happens, we are overall still printing green candles and I'm going to trade alongside. Well, I'm not going to trade alongside the green candles again. I've already mapped out my scenarios and it's the first of which is at this extreme. Second of which is that I want to see just like a double confirmation, right? Because this is just one CISD in an overall like, I don't want to say bullish trend, but like we have reasons to believe why price is going up in the fact that we have these relatively equal highs. Something that I do want you guys to try to pick up on or at least notice is the thought process here. I am not necessarily just having one bias and jumping straight into it. The mindset of a trader should be one where you prepare for multiple scenarios and you simply wait, be patient, wait until those scenarios show up and then you can get in to the trade. And in this case the scenario is, is that I want a break below this block right here to confirm bearishness. And in terms of bullishness, I want to see these liquid like relative equal highs get swept, coming back into some kind of key level and then off you go. So those would be the scenarios. If you guys enjoyed this video so far and you appreciate an analysis on crypto done from the smart money perspective, make sure you subscribe. Turn on the bell notification, drop a like on this video and if you want a free trading course delivered straight to your email, it's the first link in the description box below. Anyways, I'll see you guys in the next one. Bye bye.










