Bitcoin: Largest Long Liquidation Since 2022
Bitcoin just saw its biggest long liquidation since 2022. The Art Of Crypto breaks down what triggered the selloff, where the price moved, and what traders should watch next in this volatile stretch.
Chapters
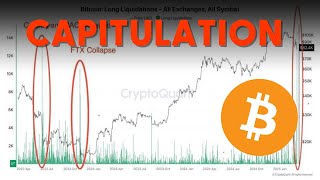
What's up guys? Welcome back to the daily Bitcoin update. Yesterday scenario was perfectly spot on. We basically said that the previous weekly low would have to be taken out first before any sort of upside move. And at the time that we were recording the video yesterday, we had just swept the highs. And I was basically talking about how there are pretty much two ways that the day could go. One is that you break below this blue box here that will confirm a change in state of delivery, or rather continuation in state of delivery in terms of bearish order flow. The second would be that you sweep this high again and you fill in the fair value gap and off you go. And there was a potential for yesterday to also be a consolidatory day because there was no news. And today, tomorrow, Thursday, Friday has news. Overall, I think this is going to be a pretty volatile week. So I'm going to just give you the game plan on what to do from this point onwards and just tldr you might not like the answer, but the short answer is that there is nothing much to do yet. At least we don't have enough confirmation. But from the higher time frames, just to give you an idea, if you take a look at. In fact, let's start all the way out at the higher time frame on the weekly chart. So first of all, the fact that you've swept the previous weekly low gives you an opportunity to perhaps head back up to the previous weekly high. Right? So the fact that this low is swept means that there is a reasonable amount of evidence to believe that hey, price is eventually going to head to the upside because that's where the liquidity is at. For those of you who don't understand what liquidity is, think of previous swing highs and swing lows as just a lot of traders placing their stop losses around those levels. For example, today we had quite literally the highest amount of liquidations that we have ever had in the history of bitcoin. Basically in the last three years. This was the Celsius N3 AAC collapse in terms of bitcoin long liquidations. This was the FTX collapse in terms of bitcoin. And today we have completely broken through that number. And yeah, like just a lot of people got stopped out. Why? Because you have swept the previous weekly low. This is a point where the market is quite literally at all time highs in terms of fear and greed. Fear mainly. And like this is where liquidations happen. This what happens when previous swing lows and previous swing highs are taken. So once there are enough liquidations and Once enough people have capitulated and the market makers have stopped out enough people and made the belief essentially that hey, crypto is going to go to zero and that they should take some shorts at this point. That's the point when they will reverse the market in the other way, or rather in the other direction to target the opposite side of the liquidity. The opposite, this case it would be buy side liquidity at the previous weekly high and even two weeks previous weekly high and as well as the current all time high on bitcoin. Now, I'm not saying that this is going to be the bottom going to the all time high right now, but there is like we can now start looking for confirmations to jump into long side trades or even just buying into crypto, as you know, swing trades or even investments. So the way that this is going to play out and the first thing that we really want to see in terms of this week is that one, we, we do not want to see a weekly close underneath $78,000. Okay? This was the swing low that just got taken out. There are only two ways that this can go. One is you close underneath this level, which means that first of all price swept this level, but there were not enough interested buyers in keeping price above that level, which means there are more sellers than buyers, hence we can reasonably expect price to continue heading lower. Now the second scenario is that you sweep the low and you fail to close below it, which, which means that there are interested buyers and this is a point where you can start to look for longs. If you get a weekly close above this level this week, then next week you can reasonably expect to go long targeting the previous weekly high. But until next week happens, and until we get more confirmation by the way, because we have only just swept the low, there is no sign yet, at least in terms of the weekly chart. Even on the daily chart, there is absolutely no sign. The best case scenario if you are a short term trader is that if today's candle closes bullish, then you can reasonably expect next day's candle to trade into this bearish favity gap over here marked out by the green box. So that's a fevity gap marked out on the daily chart. If today's candle closes green, right, let's say it closes green here, tomorrow's candle opens up here, you can reasonably expect to target that. But just today alone I think you are better off staying outside or like staying away from the markets because overall trend is still towards the downside. Overall order flow is still towards the Downside, but the problem is that you do not have any further confirmation that you are going to go to the upside. But it's also, it also feels kind of stupid to start going short here because then you'll be selling low and essentially buying high eventually in current conditions. Bitcoin's a trade that I would say is just in a no trade zone. This is a reality of, you know, a lot of trading. I made like a lot of the times. The best traders that I know, like including myself, like over the years I used to trade, try to trade every day, but now I just trade the high probability conditions. Now I've come to realize that, you know, you might be lucky if you get two to three high probability days within the week. Most of the time it's just about waiting and staying outside of the markets until the high probability conditions come back around in a moment. Again, like one hourly chart, you have a changes that are delivery. Yes, I get it. Problem is you're running into a lot of resistance. For example, that is a bearish order block. You can even say that this entire block here is the bearish order block. So again you don't have enough confirmation to go long yet. But it also feels stupid to go short here. I don't know about you but like, you know, if I was really trying to force a trade then perhaps I'm going to lean towards the short side. But again, ideally you don't want to be in a position where you're forcing trades. Right? There are so many other coins out there. You literally have entirely different markets in forex, in indices, in stocks and everything. Like there are so many markets that you can trade and it's so much better if you wait for a higher probability just set up on if you. It's so much better for you if you just take a higher probability set up on those compared to this one. There were like an insane amount of like, I don't know, motorbikes or whatever that just passed by. So might hear a little bit of noise in the recording, but hopefully it's not too bad. Just to give you guys the rundown, we are still in the exact same situation, but just to give you guys another rundown. Today is probably a no trade zone. If today's candle closes bullish, then perhaps we have a trade tomorrow. But chances are this is going to be a counter trend trade. Meaning you're just trading into this favorite gap for further continuation until proven otherwise. And the condition that would prove this otherwise so that you close above the fever gap. Come back down to find the fever gap as support. Right? You flip the bearish fever gap into a bullish fairly gap. You find support at that and off you go. That will take a few days. We're looking at the daily chart here and it's so much better for your trading when you wait for higher time frame confirmations and to trade in line with the higher time frame direction and order flow. And guess what? Higher time frame means that it takes time to confirm. If we confirm it within this week, amazing. We're lucky. But chances are we're probably going to need to wait till next week for just really high probability conditions to show itself. The other scenario is that if this week's candle closes bearish, then well guess what? Next week we just continue trading bearish. Overall the direction is going to be so much more clear and we're going to get just such like more clean movement, let's just put it that way. But do not forget overall in a macro we are really bullish. Fear and greed index is quite literally at all time highs in terms of fear. We have had the biggest liquidations in terms of longs. Since 2022, M2 Money Supply has been starting to go like just starting to increase. And M2 money supply, for those of you who don't know what it is, it's just global liquidity, more liquidity that you have in the markets. The more money's flowing around in the global markets in general, the more money that trickles into crypto and risk on assets such as, you know, indices as well as especially crypto. So short term we're still going to play it really cautiously. It's why I'm making these daily videos. So if you appreciate these analyses done for the smart money perspective, then subscribe like the video and stay tuned for the next one. And if you want a free training course delivered straight to your email, it's free. By the way, it's the first thing in the description box below. Otherwise I'll see you in the next one. Bye bye.










