Bitcoin Market Maker Sell Model Playing Out
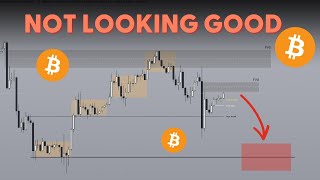
Bitcoin is showing a market-maker sell setup on the 1-hour chart with three bearish targets between $81,250 and $84,000. The speaker favors shorts until an hourly close above $90,000-$92,700 invalidates the pattern. Watch Non-Farm Payrolls at 8:30am NY time for volatility.
Chapters
Good afternoon my friends. So today, bad news. Bitcoin has just confirmed the market maker sell model that I was talking about yesterday. And this has been confirmed on the lower time frames, but not yet on the higher time frames. But the fact that we identified this in the first place on the 1 hourly chart, as you can see right here. So original consolidation, one leg, second leg, third leg up into the fair value gap. This, by the way, was the time that I was making the video yesterday. Unfortunately we did not break above this level and yesterday also ended up becoming a consolidatory day, just like one of the scenarios that I predicted. The fact that today you have non farm payrolls coming up later you won't be able to see on bitcoin. But if you go onto a USD chart today you have non farm payrolls at 8:30am so expect that hour and expect today to actually be quite volatile, especially for the forex pairs. But honestly, if you know this affects forex and it affects the indices like the S&P 500 or the, or the Nasdaq, then you can reasonably expect some kind of volatility for bitcoin as well. And I'm going to give you guys the playbook for how to navigate today. But I'm also here to tell you that this is not going to be too big of a concern because if you take a look at the weekly chart again, we already established at the start of this week that this week was going to be an inside bar. So far, unless today non farm payrolls brings Bitcoin from $88,000 and dumps it below $78,000, it's still unlikely to close below the previous weekly low or to close above the previous weekly high. Essentially we're still just, you know, kind of consolidating in terms of the higher time frame. And chances are we are currently just trading in a range until proven otherwise. This was a scenario that was discussed earlier this week and has so far been coming true. Taking a look at the daily chart again, you have, you don't really see any sort of village gap or any sort of order block over here, but the fact that you had a kind of like a bearish candle means that the daily bias today was actually going to head towards the downside and you have already taken out the previous daily low so that in terms of that bias, it's already complete. So now we just have to play the lower time frame chart. Now another potential level that price could hit today, which is taking a look at just daily draws on liquidity because Right now we're just trading between this level right here at $95,000 and $81,000. So hopefully we don't dump all the way down to 84. That's going to, that's not going to be a, a beautiful sight to behold, but at least on the one hour time frame, as much as I hate to say this, the setup seems to be lining up towards the fact that we are going to be bearish until though until proven otherwise. So I'm going to give you guys the scenarios as well. So taking a look at the market maker sell model, this is coming into the favor gap that we marked out. And the fact that the you did not hold like this was a bullish order block right here. The fact that you did not hold this and you even broke below it, came up and then rejected off of it means that this is now a, you know, confirmed market maker sell model. And when it comes to market maker sell models, you tend to return back to the original consolidation, if you take a look here. So if the original consolidation, you tend to go back to the original consolidation to complete a market maker sell model. Now one of the reasons why this is not going to be a really terrible outcome for Bitcoin is the fact that, the fact that first of all the fact that we predicted that this week was going to be an inside bar means that chances are you're just going to chop around. And in terms of chopping around, you currently have two ranges. One is the fact that this is a range high and and currently where you are at is the range low. So one can say that you have swept below the range low and you know, you're potentially going to have a bullish movement later on, which I'm going to discuss by the way, like what do you exactly want to see for bullish movement? But otherwise you have a second range which is just the previous weekly high and the previous weekly low. Which means that again, until any of these levels are closed, above or below keyword close by the way, not trade like you can wick below this level and recover really quickly. And that's not bearish. Yeah, until either one of these levels are broken, you are in a range until proven otherwise. And in terms of the range, given the fact that this is a market maker sell model and just following the market maker sell model, if you return back to the original consolidation, that means that you take out $81,000 and again it'll just be a sweep of the range lows and then from that point onwards you can expect Some kind of market maker buy model. In fact, very likely what you're going to see is some kind of market maker buy model with this being the original consolidation. This is your first leg, potentially your second leg and then your final leg here. This is a complete market maker buy model to where they will. This will set Bitcoin up for further upside. So that's going to be the bullish scenario. And just to give you an idea of how you can play this to take advantage of specifically scenario one, which is the market maker sell model. On the one hourly time frame you want to look for this further gap right here that we've identified on the 1 hourly chart. Now we use the higher time frame, in this case the daily chart to determine the bias and to determine just potential targets that we can take. And from the weekly chart, from the daily chart in terms of bias weekly we know that we're in a range and on the daily the fact that we get a bearish candle close yesterday means today's daily bias is towards the downside, again until proven otherwise. So the one hourly time frame, which is your middle time frame, is what you use to identify areas of interest that can support your theory of either bearishness or bullishness. In this case, this is a one hourly five gap that we expect to trade to within some kind of session. And currently we are almost done with the with the London kill zone which starts from 2am and it goes until 5am we're pretty much almost done with that. So the session to look for is going to be on New York. So later on during the New York kill zone which runs from 7am New York till 10am and in this case specifically you want to look at 8:30am because that's when non farm payrolls are released. And non farm payrolls, for you guys who do not know what that is, it's a red folder knees event that happens usually once every month, can be a couple of times as well. And this is for traders, this is the gold standard of news events because non farm perils is a very volatile news event. It brings really clean price action and it brings really volatile movement, especially for your indices where you have a lot of trading volume going on there. So later on during non farm payrolls, if price trades into this favorite gap and starts showing signs that it's going to reject downwards on your lower time frame. In which case if we're going from the daily chart to the one hour, our lower time frame is going to be the five minute. You see signs that you Know, hey, price is starting to go down, then that is going to be kind of your trade, right? Taking advantage of the fairbility gap and then targeting the current daily lows or potentially just shooting for a 2R. So that's going to be like how you play the bearish scenario. Another potential that can happen is that non fun payrolls again now we're discussing scenario two. Something I love to do is to give you guys if then statements so that you guys are prepared for every possible outcome. Our job as a trader is not necessarily to predict what a market is going to do because there is a big difference between what you want to see in the market and what the market actually gives you. And so it's much better to prepare yourself for every possible scenario. And so when the time comes you just read and react. This is a very underrated mindset hack or just an underrated mindset in general that you need to have as a trader to succeed as a trader. Anyways, second scenario would be that NFP actually just starts chopping around so you get a really bullish movement to the upside, really bearish movement to the downside and the candle is just gonna be like really explosive but like no clear direction. That is also a possibility. But either way this is going to be the level to look at. And in the event that you do get a really big like screw you candle, then chances are it's going to come to these relatively equal highs on the one hourly chart right here. So it's going to be right here at 912-509-1400 as well as 91600. If you sweep any of these levels during NFP where that's a very, very explosive move, you can look to take a short at this area just back down to like kind of like this, right? So this might be your opportunity. This could also be your opportunity as well. But I would suggest not going long until proven otherwise. Because overall in terms of order flow, if you read the order flow here you have a now let me just draw it out for you so that you guys can see clearer. That is a bearish order block. You break below trade above and then you get rejected and the same thing again, you have a bearish order block with this up close candle here, price trades below, comes up, fails to break above it and goes down again, right? This is already very clear signs of bearish order flow. And so you should stick to shorts until proven otherwise. This is in line with the market maker sell model that we've been able to identify. As well as the Delhi bias, those are going to be the couple of bearish scenarios. The third one would be if price happens to break underneath this series of up close candles. So instead of returning to the fevigab, although I do think that we are going to retest the fever the gap today and you break down lower, this is going to be your second opportunity where if price breaks through this like you get a candle close on the one hourly chart underneath all of these up close candles, that means that this is a change in, not necessarily a change in state of delivery, but this is another confirmation that you are indeed in bearish oil flow. And you can just take the trade for continuation to the downside to in this case it's going to be 84,600, but you can also aim higher at, well in this case lower at $81,250. So this is going to be the bearish scenarios for bitcoin. Now let's talk about the bullish scenarios. Like what would we need to see happen before we can confidently say that hey, we are now bullish? So ideally the bullish scenario would involve some kind of a invalidation of that fair value gap, right? Essentially the price to close a counter close above the fairly gap on a one hourly chart. This will signal the fact that hey, for the first time since in this case we're looking at a one hour, so for the first time since Thursday we have now broken the streak of bearish order flow. And for the first time you are getting like bearish PD arrays that are not being respected. And that's like step number one, right? Ideally you want to break above the fertility gap and even try to like close, right? Get a candle close above this series of like down close candles right here, which is going to happen at around $90,000, 250. Now I know some of you are going to immediately say, whoa, you know, that's a lot of time that you need to wait for these things to confirm. And guess what, that's the job of a trader for like 80 to 90% of the time we can identify all of these really high probability areas. In fact, I'm pretty sure even you know how to identify the high probability areas. You have a really good understanding of the charts and how to read the charts and how to predict movements. But the problem comes when you don't wait for the things that you yourself planned out for. And that's the job of the trader, right? You plan it out and then wait until it happens once you get the confirmations Then you get in. What happens before you get the confirmations is that you might get in too early and the trend hasn't confirmed to be, you know, going to the upside yet and you get absolutely screwed. You get into a trade, you buy long, you buy high here and then price reverses and you're like ah, crap. And now you've just, you know, bought high salt low. So yeah, in this case you want to see a confirmed change in state of delivery, right? So this would be confirming your CISD which you want to see before you dive into longs. This by the way would also invalidate the market maker sell model that we are currently seeing play out on a one hourly chart. So this is going to be a key area to break. So it's going to be scenario number two where you break above and then you can look for any sort of retraces back down below. And by the way, keyword, you want a candle close above the level. You don't want to just get a wick and price starts trading lower and then you buy into that, you are going to get stopped out if you are towards the long side. So a retracement into, you know, could even be this FE gap right here and for upside to continue. So again look for this during non fund payrolls later. But overall, just so I am painting a realistic picture, the bias at the moment is towards the downside. It's going to take a bit for bitcoin to show bullishness, but if it shows bullishness it's going to be a really positive sign because it'll mean that your favorite gap over here has been respected. And in terms of the higher time frame, let's take a look at a four hourly chart. This is a fairly gap. If we can refine this down. So that's a fairly gap it got traded into. And if price forms a new high breaking above 92,680 or like $92,600 $700 basically this high right here. And this is going to be so bullish because if you take a look at market structure, it'll be high, low, high, low right now, higher, high, sorry, higher low. And then boom, you get a high high and then off you go. Right? That's going to be kickstarting the bull market. Just one last thing to remember in terms of the higher time frame, if you take a look, you are currently. This is what happened whenever you sweep the range high, right you go all the way back down to range low. Currently we are at the range lows and we have just swept the range lows. Price is showing signs that it wants to accept back into the range but so far it got rejected off of this new resistance right here. And you know it's sort of consolidating which again we expected, we expected this week to be consolidating because how big last week's range was and market conditions play such a huge role when it comes to trading. It's like when you are dealing with ranging conditions you need to you know, getting get out quicker and if you're in trending conditions, well obviously you hold for longer to maximize the amount of profits that you do make on your winning trades. Anyways, we are at least on the higher time frame in a area where we want to look for longs so we get those confirmations on the lower time frame. That is going to be absolutely brilliant for bitcoin and it's going to drive bitcoin to a new all time high come summer. Anyways guys, if you would like to learn exactly how I do this on a real time basis you get you can get access to a free trading course that I'm going to deliver straight through your email by clicking the first link in the description box below. If you enjoyed this drop a like it truly does help keep me, you know wanting to make these videos. Otherwise have a great day. Peace, safe trading.










