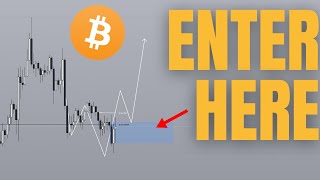
Bitcoin setup using order blocks and liquidity sweeps, targeting $95,000 with entries around $83,800-$84,100 and a stop near $83,150. The speaker covers position sizing, managing losing streaks, and judging performance across 10-trade blocks rather than single trades.
Questions this video answers
March 21, 2025.
0.705 for entry zone; 0.886 as the stop threshold.
Mid-order-block entry ≈ $83,800; order-block entry ≈ $84,100.
Approximately $83,150.
Previous high near $95,000; quoted ~11.5:1 risk-to-reward.
Chapters
What's up, guys? We have been on an absolute roll lately. The exact situation that we predicted and called yesterday has once again come true. We have a first tap into the area. You have a second tap currently on the way right now. And hey, you know, if things go as though my crystal ball is telling me, then we are going to get a change in character or just some kind of change in state of delivery on Bitcoin right here to form your bullish order block. And this is going to be the area that you're going to enter. Boom. Right there, Right there. This low right here is also a strong low, which is exactly the reason why I drew the second tap. You never want to be longing into a weak low, which is a low that does not sweep liquidity. In this case, you have a low that sweeps this liquidity right here and this liquidity right here as well as the liquidity right here. So that's a really positive sign for the people that are going long. And the reason. And now let me show you a couple of bad examples of shorting into weak highs. Right Here you have 1 high, 2 high, 3 high. These are relatively equal highs. If you started shorting at any point here, even though things might check out out, the fact that you have these relatively equal, you know, weak highs back here means that they'll eventually get swept. And that's one of the ways that you can use to prevent yourself from getting into trades too early or just getting into trades and then getting stopped out before the move actually happens, where, you know, you might have predicted that, hey, you know, price is going to go down or like, price is going to go up. But then you might go into early, you might get stopped out before the move happens. This is one of the ways that you prevent it. And another example, both of these cases, by the way, we mentioned basically publicly saying, like, hey, I would love to short right now because we have, you know, a confirmation in the change in order flow towards the bearish direction. But the fact that you have these relatively equal highs back here as well as here means that they will eventually get stopped out. And so glad that we are keeping this in mind. And this will be the opposite case where, for example, this low and this low that forms here are lows that form after sweeping liquidity right here and right here. Over here, you have 1, 2, and 3 relatively equal lows. This becomes your strong low. And this is going to be the area where you want to trade from now, from the last few days, what we have been looking for in terms of bitcoin is a second broken base. So a broken base is when you have a liquidity sweep down here and then you immediately break structure in one strong move. In this case, after you sweep out all of the. After you take out all of the sell stops, basically, like everyone that are going long has basically gone and stopped out. And people that are shorting, you know, quote unquote, the breakdown here, the moment price reverses, they're going to be trapped. And that's what we want to look for. And the fact that price forms new market structure, at least on a one hourly chart, is a really positive sign that, hey, there are interested buyers in pushing price higher. And that's the sign that we want to look for. And in this case, the reason why we want to look for two broken bases in a row is because this leads to an a setup known as the broken base double confirmation. Double. Double confirmation is literally. I know it sounds really fancy, but it's just a broken base happening, you know, again, without the first broken base getting invalidated. So price actually eventually just retraced. Like if I draw a fib from this low to this high right here, Price eventually just retraced into the 0.705 of this initial break and base, which again we called. We wanted to see price come in here and to sweep all of these lows before we started going long. A lot of people would have went long here, but no, we know better about how the market works. We know better about how to manipulate retail traders. And that's why we called it here. This is your range deviation. And as price breaks up, you confirm the order block and off you go. And so right now, this is your double confirmation. Now I just have to draw a fib, which, by the way, this is how I predicted that price would retrace into this area right here. It's using the fib. Go from low to high of the broken base. Look for 0.705. You want to look for price to not go further below and to touch the 0.886, which is why this is going to be our stop loss right here. Like if the price were to just go below the order block. And by the way, the order block is not going to be obvious on the one hourly chart. Was it on the daily chart? Yeah, so it's on the daily chart right now. Price is retracing into that daily order block. So you don't want to see price touch the 0.886. I know this looks kind of awkward because the 0.86 should really be much lower. It's because I'm on a log chart. So if I draw it like this, it's going to be more obvious. And the way that we managed to predict that price would come back to this area was also by drawing a fiber from this low to this high. We want to look for price to return to the705, but then not to go below the 0.886, which is this blue line right here. And these are just magic numbers. Don't ask me why, but they work. And right here, this one hourly candle as of the time that I'm recording this video right now, which is during the New York futures open at 10am the fact that you are getting a bullish move right now is a really positive sign. If you do get a candle close above, these two down close candles right here, they will validate it as a potential order block. So that's going to be your setup. Okay, if you're watching this now, then that is going to be a setup. Your stop is going to be at the low and this is going to be your order block. Now there are two ways that you can enter based on an order block. The first is at the start of the order block and the second is at 0.5 or like the mid range of the order block. So in this case that's going to be right there at 83,800, at least on the Binance Perpetual contract chart. And the other one is going to be right at the entry of the order block which is going to be at around 84100. And your stop in this case is going to be right about 83, 150. And the target, of course you're targeting the previous high right there. But if you zoom out a little bit, which is where the higher time frame comes into play, there is potential for you to reach all the way to this previous high right there at $95,000, which would give this a 11.5 to 1 risk to reward ratio. But even though I am calling this trade right now, just understand that I can be wrong. Now my analyses are very spot on, but when it comes to trading, just we need to accept the fact that trading is a game of probabilities. Even if you do everything right, there is still a chance that you lose. To give you a example that might be easier to understand, in poker, some of the best hands that you can possibly have is for example, a pocket ace or pocket queens or even pocket queens. These are statistically the highest win rate probability Hands that you can possibly start with, meaning before any of the cards have opened on the flop or the river or anything. This, just having these cards in hand means that you want to be aggressive, right? The right move here would be to be aggressive. You want to raise, you want to call, you want to play the hand, doesn't mean that you will always win the hand. It just means that if you played that hand a thousand times, chances are you might win, you know, 60% of the time compared to on average, let's say 30% of the time. And that's all you need when it comes to trading and even your job as a trader is to simply wait, sit on your hands until these high probability opportunities come by, which in this case it's a broken base double confirmation retracing into the 0.705 with a potential one hourly, you know, order flow confirmation. Not yet though. So filming this, there is 25 minutes left until the hourly candle close. And you really want to see an hourly candle close above this, you know, down close candle before you want to say you're confidently in. So whether or not that takes the next hour, or if it takes two, or if it takes, you know, the entire weekend, because right now we're about to enter the weekends. Actually, I take my words back real quick. Do not enter this trade, ideally, unless you get just really clear confirmation like, hey, you know, your bullish order flow we're about to enter into the weekends, which means that there can be really choppy price action and you might get manipulated out. So just something to keep in mind. But overall, like all of the criteria does add up and this is the A plus opportunity that we have been waiting for for quite literally a week. And so when it shows up, we just take it. And again, this is exactly what you want to see. The way that I drew it out, this is not a coincidence, the way I drew it out, call it inverse heads and shoulders pattern, whatever. This is essentially just another, you know, mini broken base in a grand scheme broken base. Now one thing you want to keep in in mind though is that at least on the daily chart, again, I want to remind you that this is the start of a reversal, or rather a potential start of a reversal, because for the most part, if you take a look at price from the previous all time high, we are still in bearish order flow. For example, once you break below like previous order blocks, in this case, that's a bearish order block. You break below, you come up, you retest it and you fail to break above It. So now this validates another bearish order block. Price breaks below it, comes back up, fails to break above it. And that validates yet another bearish shoulder block. And right now, I don't know if you guys can notice, but this is one big bearish shoulder block right now that we still have to overcome. So while you are taking along here, just understand that this is by nature countertrend because the trend overall is still pointing towards the upside. The lower time frames have already started shifting trend. But this could all just be a like a retracement in the grand scheme of things. For example, price retraces and forms a new low. Right now you could even just be retracing to form a new low. Do I think that's going to happen? Well, only time will tell. Like our job as traders is to take a bet when the odds are with us and ultimately not to judge our wins or losses based on a one trade sample size. Win or lose doesn't really matter. What matters is that over the course of 100 or even 500 or even thousand or 10,000 trades, as long as you win more than you lose, that means you have an edge as a trader and as traders, that was what you want to be focusing on. So many times I see beginners completely get this the other way around where you know, they judge their entire success or failure as traders over the last, you know, five trades. If they've just lost five trades in a row, they get really salty, they get really depressed and they start doubting their abilities. When in reality losing streaks are so common. Like I'm going to pull up this shot for you just to show you how common it is to go through a 5 lose, like 5 consecutive losing trades within a 50 trade period. Right? This isn't even 100 trade period, this is 50 trades. So check it out. 5. If you have anything under a 55% win rate, you have a 90. It's pretty much guaranteed that you're going to go through five losing trades in a row within a 50 trade period. And some of you watching this may understand this logically, but when it comes time and when you are in the moment, it can be pretty tough to pull yourself out of that emotional state and to see it for what it is that is a part of the game. So my advice to overcoming like really negative emotions when it comes to losing streaks is, you know, don't judge yourself based on like really small sample size. If anything, the minimum that you should be judging yourself is on a 10 trade block period. What that means is that as long as you're performing slightly better over the next block of 10 trades, then that means you are improving as a trader. And over time these incremental improvements can add up a lot. And ultimately, this is what I try to impart to you guys. Aside from talking about price action and talking about technical analysis and giving you guys trade setups, I would also hope to educate you guys just on the mindset of, you know, successful and sustainable, most importantly, sustainable trading. Everyone makes money trading, very few keep it. And even less are able to, you know, stick around for the long term to actually multiply that money. And I hope that you guys are going to be the latter too. And speaking about education, if you want a free trading course delivered straight to your email, teaching you about my mindset as well as my trading methodology, as well as just, you know, common mistakes that you make as a beginner trader and how to fix them, then click the first link in the description box below. But otherwise, have a happy weekend. Subscribe if you want to see more analyses done from the smart money perspective where we manage to, you know, manipulate, or rather see the manipulation of retail, subscribe and turn on the bell notification because I'll be making videos pretty much on the daily on every weekday. Other than that. See you guys in the next one. Bye bye.










