Bitcoin: This Once A Year Pattern Just Happened
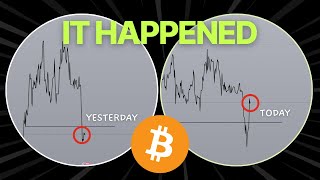
Bitcoin just hit a pattern that happens once a year. The speaker shows a checklist for catching bottoms: capitulation, range, liquidity sweep, retrace, then entry. Bitcoin target is around 96,400.
Chapters
Good morning, guys. I literally haven't woke up this early in like six years. So happy and yeah, what better way to wake up to seeing the crypto markets pump. And after, right after making a video that is essentially saying, hey, we've seen this pattern on bitcoin before and it's very likely that we are going to bounce from here. This week is going to be very telling, but I never would have expected that right on Monday we would have had this kind of movement. But I love to see it. This is a really good time for crypto. Going to talk about bitcoin and then I'm going to talk about withm Copycat because they are finally showing some movement. And I called popcat on Discord. Now I know I have made a couple of mistakes in the last couple months, which is why I have decided to track all of my trades and all of my analyses publicly so that over time we're going to build a really good track record that hey, like, even though I might be wrong, you know, one out of three times or one out of two times, but overall when I am right, you know, we still make more money than not. For example, last month, to be really public about this, in terms of public trades that I called, I was a 4 out of 11 for 36% win rate, which is not my best month, but we were up 6% or like 6R for the month, depending on how much you risk. Could be 6%, could be 3, could be 20. But either way, the real, you know, telling stat that you want to look at is 21 out of 29. Now the way that I'm judging this, 15 out of these 29 by the way, were posted on YouTube publicly last week during the weekly outlook and 10 out of 15 of them were correct. And the way that I am judging the, the criteria for whether or not I'm right is whether or not the target gets filled. And in this case, I was right for the most part. And now, hopefully with a bit of credibility out of the way, let's get into some quick analyses. So bitcoin, the situation that we were talking about in terms of how history is repeating is when we hop back into the past. For example, every year or like every six months, we get some kind of like just before we get into it, it's like if we take a look at bitcoin, it overall in an uptrend, right? Especially when you look at the weekly chart, there is nothing about the chart that screams bearishness, right? Which means any opportunities where you sweep, sell Side liquidity, right? Which is a counterparty liquidity sweep within a trend is an opportunity that leads to an explosive movement in price. So sweep the liquidity here, boom. Sweep the liquidity here, boom. Sweep the liquidity here, boom. And as well, right? This was the bottom of the bear market. Absolute similar setup. This is also, as you will see on popcat, the exact same setup that I shared in the free masterclass that I did recently. Feel free to drop in the comments if you'd like me to send over a replay if you didn't manage to make it for that. But I basically gave you the dip buying playbook absolutely free by the way. Anyways, this is a setup that repeats, you know, I'd say once every six months or so. And essentially the reason why this leads to the most explosive pumps is I want you to think of it this way. Whenever retail traders and the majority of the market participants take a look at a low, they're like, all right, so we have a couple of swing lows over here in relative close proximity to each other. And if price breaks down below this level, first of all, you have the breakout traders who are jumping into shorts on the breakdown. Second of all, you have the traders who have placed their stop loss right underneath these levels who would all get market stopped out. And third, you have the smart traders, the smart money, well, buying up all of these positions as these people are selling low so that the smart money is buying low and potentially selling high. So the beautiful thing you need to understand here is that market is a zero sum game, right? The goal of every single market participant is to make money, duh. When the thing is, because it's a zero sum game, when you make money, guess where that money's coming out from, right? It's not just, you're not just making it out of thin air. When you win money, you're taking it from someone else. And chances are that someone else is going to be the market makers. And on the flip side, when you do lose money, guess where that money is going to go? To the smart money. That's right. So it's in their best interest to cause as many people, or as many, let's just say amateur traders to lose money as possible so that they get to pocket as much money as possible. In this case, a sell side liquidity sweep by trapping all of these breakdown traders and then flipping the market immediately is exactly one of the best setups that they can possibly have. So many people who just decided to, you know, sell low here the moment price starts pumping from here on out, by the way, they're completely trapped, right? Either they get liquidated or they get trapped in a negative P and L which they will have to exit at some point. But anyways, doesn't change the fact that currently this is a really good sign. This strong recovery is what we wanted to see when I made the weekly sort of like market outlook on Bitcoin yesterday. And so far you'll see that, you know, all of these recoveries lead to an aggressive pump, right? It doesn't take very long. By the way, this happens in a couple of weeks, a few weeks at most, where after you sweep the liquidity, 1, 2, 3, 4 weeks, and then you're off to the races. Over here, you sweep the liquidity. In this case it will be eight weeks before you're off to the races. So there is still a time limit to this. But in the 2020 Covid crash, you sweep it and almost immediately actually you're off to the races. And let's just take a look at one last example. After you sweep the liquidity here, it took one week to sort of chop around, but then like overall about four weeks before you really go off to the races. So like guys, I may be excited here, but this is really just step one of the overall uptrend and the overall, you know, setup that we're expecting. So I am calling this right now. Don't be surprised if you spend the next four weeks chopping around because historically this is what happens. And I'm not saying that history is going to repeat, but it often rhymes. And I think a very big problem most people struggle with is understanding the concept of waiting when it comes to trading, right? I might call something and if it doesn't happen within a few days, people are like, oh yeah, this guy, this guy always says, you know, stuff like this and like, oh, it doesn't happen. And no shit, we're looking at the weekly chart here. It's only normal to presume that stuff on the weekly chart is at least going to take a week, but more likely a few weeks. So anyways, that is the breakdown on bitcoin at the very moment I think this week is probably going to play out like in terms of the power of three just going lower. But ultimately, you know, you get an open high, lows, open high, low, close higher. With the previous weekly high as the draw liquidity in this case, we're probably going to head towards the upside with 96,400 as the target. Now the second scenario that could be possible is that you just straight up get an inside bar because of how volatile the last candle is. Inside bar means that you do not touch the previous weekly high or the previous weekly low. In fact, it is very likely that you do not touch the previous weekly low given how far away it is at the moment. So an inside bar is basically just a very choppy week. Also, this is the first week of starting the new month. Now, for those of you who know anything about amd, you know that the first week of the month tends to be accumulation. Second is manipulation, third is distribution, and fourth is reversal. Ideally you want to be taking your trades in either manipulation or distribution because it's really clear which direction it's going to go to. Also, the volatility tends to be a lot higher. There's nothing wrong with trading accumulation. Just keep in mind that these are slightly lower probability market conditions that you're going to be trading into. And as long as you keep that in mind, maybe keep your risk a bit smaller, keep your, your targets a little bit smaller as well so that you're not expecting a 50 move in a market condition that will only give you 5%. So just quick note about market conditions and how you can use this to your advantage. So remember that I promised you guys about a setup on popcat and in this case popcat is showing if you guys remember the exact setup that I talked about in the masterclass. And this is proof that, hey, it's working. And I even called Pocket specifically in the masterclass and so far it's up about 30. Well, depending on where you got in, 20 to 30%, which is great. And this is just the start of the move. So what exactly am I talking about? Essentially a really big dump. So this is what's known as capitulation, not some kind of a slow dip down that would be, well, just a dip that keeps on dipping after you get a capitulation. What you want to see in terms of step two is a range to be formed. In the past I would have said a valley area, and this is indeed a valley area. And the third step that you want to see is some kind of a sweep of the range lows, which we've got here. Right here we got a sweep of the range lows. Fourth is if we want to see a change in the state of delivery, which is essentially the down close candles or just a change in terms of order flow. And in this case this is the first step to signaling a potential bullish order flow. Now, fourth step is we want to wait for a Retrace back into the CISD block. And fifth step, we want to take a trade on the retracement and we want to place our stop loss underneath. And then ideally, if you can make a new high from that point onwards, which this is the high right here and you make the new high within the same day, then this is pretty much all the confirmation you need that hey, we, the bottom is very, very likely. And I'm not going to say 100% because you know, this is still a game of probabilities. High probability doesn't mean 100% probability. But still in terms of the scenario, in terms of the checklist that I used to trade historically, this is the exact system that I've used for years at this point. And it's always seemed to work well in terms of the probabilities. It always adds up. And yeah, like it doesn't matter if you're, you know, if you have been wrong for a certain amount of period. Every system can go into a drawdown. As long as you see the criteria being met of the system, you just take it, right? That's what it means to be a trader, to have a set of rules. And when the rules are met, you take the trade. It's not about, oh, you know, I lost, I lost five trades recently. So you know, I'm not going to be as confident in myself. Like guys, it's trading, it's supposed to be robotic here. But anyways, for those of you who you know, are familiar with the concept of a volume profile, you will have seen the setup by now, right? This is a sweep of the valley area low, right? That would be a discount opportunity. And right now you are definitely oscillating back towards the value of high in this case. This is my trade, it's about 10r and my target, I think popcat goes to 70 cents. Pretty convinced, like pretty convincingly. If you take a look at the monthly now there is only one possible like area that might stop boccaccat and that's going to be at about 56 cents. So I'm going to just draw this level out right here from the monthly chart and see if it lines up with some other levels. And it does indeed line up with this weekly level at $0.50 4. So this could be a first TP. But for the people watching this video right now, like what is the setup for you? So essentially right now as you're trading above this block, this becomes your new change in state of delivery or rather this becomes your new order block. And so Right now as the time to watch, as of the time that you're watching this, this is already a good setup. So placing a trade at the start of the order block, placing it at the end and first TP at 54 cents, this will give you a 4 to 1 risk to reward ratio. Alternatively, you can also start it here, place it at the bottom of the order block, meaning the order block right here. And this will increase your risk to reward by quite a substantial amount, almost doubling it to 5.56. And this is probably going to be the setup. Now why am I recommending this setup? Just so you understand the setup checklist or like this, the criteria that I'm looking at. First of all, you have a weak low over here, which is swing low. That does not sweep liquidity. Now that weak low actually filled in this favorite gap on the daily chart. And right now you got a second fill of the fairly gap by sweeping out the week low. Right. Notice how you, even though you have a wick down here, you do not close below the fair value gap. In fact, even prior to this, we had already had changed the state of li. You're like, we have so many other factors lining up that overall this zone here is just kind of like a bottom zone and the way that you're going to be able to take. And again, just to explain the criteria this week, low here just got swept, right? Meaning the liquidity here has already been swept. Everyone's been stopped out. The breakout traders who, you know, got into the market at this point will have be. Will have been trapped and probably likely even stopped out because it propcat literally pumped by 20% overnight. And right now you are in the midst of forming a new high. Now if you do not sweep this high, which actually you already have. So ideally now we just want to see price close above this high and we're going to be all Gucci. This will become a strong low in line with the trend line. This is just textbook, picture perfect. I think we're going to look back at this in three to six months time and be like this was the setup just going to say this anyways, so that is the situation on popcat. And just to just so you understand how this works for you, when you start shifting into a change in state of delivery from bearish order flow to bullish order flow. Order flow essentially just means that in bullish order flow you have bullish PD arrays, which is bullish order blocks and bullish fertility gaps getting respected, while bearish favority gaps and bearish order Blocks are disrespected. So this is now a bullish order block. And so assuming that we are in bullish order flow, which it seems like at the moment still step one, but still when you're in bullish order flow, the way you momentum trade is you just trade all of these favorite gaps and order blocks. Just to give you an example, this is a bearish order block right here. Price trades above and then fails to break above. So price respects the bearish order block. Same thing here, right? These two up close candles are the order block. Price breaks down, trades above back into it and fails. Right? This is because you are in bearish order block. Meanwhile you have bullish order blocks, for example here they get absolutely blown through because you are in bearish order flow. Right? Order blocks and favorite gaps, all of these work, but you need to be good at determining what is the current order flow. For example, here you have again bearish revenue gap where price trades into the 50% line and boom, right, respects it. And then this series of candles here is the bullish order block. And yet they get completely disrefected. Why? Because you are in bearish order flow. This is how you use order flow. And you can see that this is step one. Now again, just step one. This is just the beginning of things because the real test of time is going to be if you can trade above all of these up close candles. If you can do that, damn, you're going to have a really, really good support block to trade back into. And for prices to really propel, like just go really high up from that point onwards. So that is the setup on with now. Sorry, that is the setup on popcat now with similarly. So with is kind of a couple steps behind popcat at the moment where you only recently just got the changes of delivery, which is for example. Yeah, let's just use those down close candles there. So just overnight you had the change in state of delivery, which means that the next step right now is that you know, you want to see a retracement back into this change in state of delivery before taking a trade. So I think the way this is going to look like at the moment, at the moment I'm recording this video, which is very early. We have a fair value gap, right? This can change throughout the rest of the day, but essentially you want to retrace back into. In fact, in this case I shouldn't even be using the fair bit gap. I should be using the 50% line of the candle. Ideally you want to see price retracing into 50% of yesterday's daily candle, yesterday's daily close and also yesterday's monthly close and this month's monthly open, weekly close and weekly open candle. So ideally something like this would be absolutely fantastic. Notice here that you have swept out the lows. So this is a south side liquidity sweep, trapping all of the traders down here, reversing the price to the opposite direction into a change in state of delivery. Right now we're moving on to step three which is a retracement and step four is actually taking a trace somewhere within the vicinity of this CISD block. Then step five is to see if this high get broken through because that will confirm that hey, you are indeed bullish. Also a really positive sign left behind is the fact that you have left relatively equal highs over here and this acts as a draw liquidity. Again, retail traders are going to look at that and be like oh that's really strong resistance or whatever. So you have people that are going to short early on here. You have people that are going to short once price breaks above these relatively equal highs like here. Let's just say that price is ultimately going to go to the upside. Right now it's just catching the right entry. And you can see that with is setting up exactly as what I've taught in the free masterclass. Like guys really share a lot of value in these masterclasses and all for free. If you guys have never joined any of these masterclasses before, keep an eye out on the next one. People have said that there is more value here in these free master classes than people have paid for courses and that is true. Right? I always try to always strive to give you as much as possible and if you watch until this point in the video so far, guys thank you for being here. A like would be absolutely appreciated. Keeps me going to make more of these updates like this and to share more of these trade setups. And if you're interested in signing up For a free 7 day email course, feel free to click the first link down below. It will be a trading course that helps you with potentially your biggest problems that you're facing right now for absolutely free. See you guys in the next one. Bye bye. Ciao ciao.










