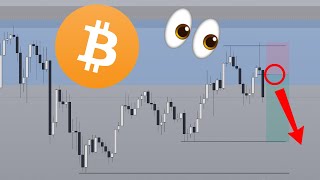
The Art Of Crypto breaks down Bitcoin's chart structure across multiple timeframes and outlines a short trade targeting the previous daily low. Expect volatility this week from US jobs data. The speaker shares their publicly-tracked trade record since February.
Questions this video answers
16 wins and 1 loss.
63 out of 76 analyses.
82.9%.
About $98,000.
$103,700.
Chapters
What's up guys? Welcome back to another video. Last month we ended up with 16 wins and one loss on all of these public YouTube video analyses. And this brings us to the running total of 63 out of 76 analyses since February, basically. And that's a 82.9% win rate over the last four months since I started publicly tracking this on February. I'm not saying that we are going to always be at this win rate, but I will definitely try my best to maintain it. So if you're new to this channel, just know that you're probably in the right place because tend to be right more often than I'm wrong. And in today's video, I'm going to give you guys the rundown on what's going on in bitcoin for the week, news events that are upcoming, as well as to give you the rundown for today and what to expect. So without any further ado, let's dive into it. Weekly chart. Last week we closed bearish. Now we are still on route to potentially filling this further gap over here on the weekly chart. So it wouldn't be surprising if bitcoin were to spend the rest of this week going towards the downside. In fact it you can go down to about $98,000 and you're still going to be fine because on the weekly chart this is just a retracement into internal range liquidity before targeting external range liquidity. Right now on the bigger picture, just understand that you can do anything. You can go up, down, left, right, inside, outside, above, beyond, whatever. As long as you do not break this low, you're going to be all good. Potentially there is another favority gap that's lower as well. So if this one gets disrespected, then this one's going to be the target. Either way, as long as you do not break either one of these F gaps. The trend on the weekly chart so far is still overall to the upside and so you expect upside continuation. This is as usual just a fairly gap retracement before upside move. For example, if you take a look here, price actually came back to the second. We'll add it lower vety gap before moving upwards. You have a F gap over here and then you have another one over here as well that price found the bottom at. And then over here this was also a fair bit gap retracement before price ended up going higher. So whatever happens like this is par for the course. You can bounce from here. You can also bounce from here. It's topped it out. And that's why these videos are, you know, made daily so that you guys know the intraday kind of update. And we'll take it one step at a time, one day at a time. So if you would like these updates that are right about 80% of the time, then make sure you subscribe, turn on the bell notification because I'm coming to you guys with daily videos every weekday. But otherwise, because the weekly bias is bearish, we can expect like there are only two things that can possibly happen here. And I think one of them is much more likely than the other. You open up the weekly here. Now potentially you may go up just as a false move before coming in to fill this further gap. Personally, this is my bet if I had to put my money. But we will again play day by day to see if there is a way that price starts, you know, showing willingness to go to the upside instead. So going back onto the daily chart, right, right now we have a internal range liquidity on the daily chart that can support our theory of like the weekly opening here and in price to do a false move above filling some kind of PD before. The true move basically is towards the downside. And this so far will line up with that theory. And another thing to add to this is that yesterday's candle was bullish. So technically today's daily bias should be bullish. Which means that right now this dump on Bitcoin could even be the move that allows us to, you know, drive prices higher. Now there is another way that this can play out is that you just break lower straight up, period from this point onwards. Either way, we're going to keep this in mind, knowing that the daily bias is kind of 5050 at the moment at least based on, off of purely the daily chart. On one hourly chart we can see that we have just wicked above what I would assume to be the Asia high. If we take a look at the five minute and yeah, that's the Asia high. And this happened during the London Open kill zone. And right now you are showing displacement to the other side, which means that this is likely turning out to be some kind of an AMD setup. The only thing that may concern me is the fact that you have, you know, taken out the high and dumped, right. But then you haven't take, you haven't filled in that daily favorite gap yet. But let's go back onto the one hour chart to see if we have potentially missed anything. And immediately, the moment we go onto the one hourly chart, you see things with much more detail so first of all, that is a bearish order block on the one hourly chart in terms of the one hourly order flow. Basically, since let's say Tuesday of last week, the remainder of the week basically played out in bearish order flow, where you get new bearish order blocks, Price breaks down, comes back up, respects the bearish order block and starts breaking lower. You have started doing that pretty much since this point, if you want to argue. And right now Price is just doing a slow little retracement up into this bearish order block before breaking downwards. So even if Price were to start just going down from this point onwards, it wouldn't be surprising because this would be the exact same setup as what we called last week on this order block right here. If you take a look at the impulse moves during this entire downtrend, you can see how much stronger the down moves are compared to the up moves. And this one was very clearly kind of like a retracement. And so far it's been, you know, you can say the same story for the price action that's been demonstrated during Saturday and Sunday, although one thing to note is that it was a Saturday and Sunday, which means that by nature they are low volatility days. So take that with a grain of salt. But otherwise this is looking like a retracement back into a one hourly order block before, you know, further continuation. And that would be where my money is like, is being put at right now. It's just going to break below, probably retrace, and then New York's going to give you continuation, probably targeting yesterday's, or rather the previous daily low right there, as well as potentially Sunday's low, depending on how volatile today is. And speaking about volatility, it's time to take a look at news real quick. And this is super exciting, guys, because we have news the rest of the week, like every single day. Monday, Tuesday, Wednesday, Thursday, Friday, we have news. Now, the reason why this matters is that, and the way I like to explain it is that at any given moment there are always three variables in trading. One of them is going to be direction. Is it going to go lower or is it going to go higher? Right. And then the second variable is going to be how high is it going to go? And how low is it going to go? That's the second variable that you need to figure out. And then you have your third one, which is when is it going to happen? Slash, how long will it last for? How long will it take for this to happen? Like basically the third variable is time. Now the beautiful thing about news and why we want to trade on news heavy days or even just news heavy weeks, why we want to prioritize trading on a news day especially is that simply put, it kind of removes the variable of time. Right? Doesn't remove it entirely, but it helps you narrow down your other two variables much more because you pretty much know that at 10am on Wednesday, for example, with USD news, price is going to move and you just have to figure out which direction and how far can it potentially go. And so you don't have to think too much about time anymore. And that's why this week is going to be one of the most exciting weeks in crypto that we have had in a while. This is basically NFP week and so this is going to be an exciting one. Going to expect a lot of volatility throughout this rest of this week. And this makes sense from this range here at 105, basically from this point onwards where price is currently at 105 to a weekly range of like 100k because that's when the daily February gap starts. So it's 985 as well as 99 and 98, means that we have a relatively decent amount of range that we can still go through today as well as the rest of this week. So at the moment, going back down to the five minute chart to give you guys the playbook for today, basically there are only. Well, I think that this will play out in one way, one main way. Right now you have taken out the Asia high. This is a classic AMD kind of setup. Although the D is already happening and it's already on route to taking out the Asia lows. Right now we have a potential target which is the previous daily low right here at 103,700. And so the playbook is going to be pretty simple within the next couple of hours. Like as of the time that I'm recording this, it is five, you know, like 5:30. Yeah, 5:30am New York. Within the next hour and a half you want to look for price to retrace potentially back to this photo gap or just back to this CISD. The exact price will be about 105, 200. You're going to want to wait for price to retrace into here. You can take an entry here, place your stop above the highs and place your target over there. So essentially this will be how I'm going to play this. As long as this happens within the next hour and a half or so, this is going to Give you an easy 2R trade opportunity with a clear AMD. So that would be the trade for today, at least so far. Based on what price action is showing us, it is probably going to head towards the downside. Now I do want to talk about kind of like a contingency plan because in just in the event that this trade gets stopped out, how do you navigate the market conditions? Because obviously if this trade gets stopped out, then you know, price is indeed going in bullish order flow. Just to give you an example of what I mean, this, this right now is changing set of delivery. Right from that point onwards, price returns back to this order block right here, gets respected breaks above. And right now price is actually retracing back into this order block at the moment. Which means there is a chance that after sweeping out this liquidity, you may just start pumping to this daily F gap. I don't know what's going to happen. What I can say though is that so far today's signal is a bit mixed and that's what I want you guys to keep in mind. If I were to be taking this trade today, I probably take it with, you know, half risk. And the reason is because of time frame alignment based on yesterday's candle, the daily bias is towards the upside. Based on the daily chart, we also have a five gap that we can potentially retrace into before an aggressive move. However, the moment we go into the lower time frames, we see a different story in the sense that the lower time frame is definitely pointing towards a potential amd. We've seen this play out time and time and time again. And so I'm not going to just ignore what's happening on the lower time frame. But I'm going to also account for what's like the mixed signals that are being shown on the higher time frame at the moment with the one hourly chart as well showing bullish order flow in the sense that at the moment price is still in bullish order flow. Now you could argue that this is changing state of delivery, which is fair enough. And so this is still, this still is a valid trade. It's just if you were to be in this trade today, I would take, you know, lower risk. This is still my official call in the sense that this is still valid. But again, just be aware, this is not one of those days where like we have had days before where all three time frames are aligned and the trade plays out beautifully. Those are the days where I'm like, okay, 1%, 2%, 3% risk even. But I think so Far as of the time that I'm recording this at 5:30am there's not enough price actions for me to go to be just absolutely sure that this is what's going to happen. And so if it happens, I'm going to take trade but half risk. And this is kind of like dynamic risk management, which is a part of trading, right? You're not going to take the same amount of risk in every market condition. If you think that it's still a like. Basically the way I approach this is I split my trades up into three levels. Level one being, well, there's not enough conditions being met to take any trade. And so level one is basically no trade. Level two is that I have enough of the conditions. Maybe let's say 8 out of 10 conditions are met and on paper it's a valid trade. But maybe market conditions or one or two factors are missing which leads me to believe that, you know, I'm going to grade it a little bit lower and hence I'm going to take a little bit lesser risk. And then I have my level three setups, which is basically, in other words, your A setups. And when those come around, they don't come around very often. But when they do come around, you hit hard, right? Shoot for the home run because those trades don't come around very often. And when they do, they have the potential to grow your account by quite a decent margin as long as you're putting in enough risk into those trades. That's how I'm approaching this. This is 100% a level 2 kind of setup at the moment. I may look back tomorrow if price action just like shoots down. From this point onwards, I may be like, yeah, okay, this was just a retracement move, but again, going to stick to my system. This System has been 80% right over the last four months. And the system tells me that in order for a trade to be considered an A trade, I need time frame alignment, which means the daily needs to be pointing down, the one hourly pointing down and the five minute pointing down. At the moment, five minutes pointing down, one hour is potentially pointing down and the daily is not yet pointing down. With that in mind, in about four weeks I'm going to be hosting another masterclass. This time around I'm going to be teaching you the exact mechanism of my system. That's right, what this system that you're seeing that got an 80% win rate over the last four months. And basically I'm going to teach you guys how this works and how to use it for yourself. If you are interested in this masterclass, I want you to click the first link in the description box below to sign up to the newsletter. Because when the link becomes official, we're going to be posting it to the newsletter first. Right now we're still working on the landing page, but I definitely have the idea for this masterclass to be a masterclass where I share with you this system. It will be completely free. If you're interested, make sure you sign up early, because we've had a couple of master classes before where people that sign up too late were not able to join the Zoom because we completely went over capacity. But otherwise I'll see you guys in tomorrow's video. Ciao.










