Ethereum: We've Seen This Pattern Before
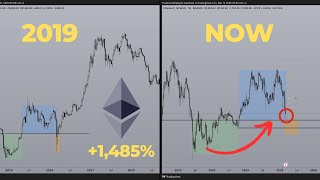
Ethereum's chart shows signs of a generational bottom, with key confirmation levels at specific order blocks. The presenter ties price action to macro factors like M2 money supply and expected rate cuts, but warns bearish order flow persists until weekly and daily closes break resistance.
Chapters
What's good, guys? It's been a while since I've made an Ethereum video, but feel the need to talk about it now because it's in such an interesting position in the markets at the moment. So obviously we all know that for the past few months, in fact, for the past couple of years, really, Ethereum has been getting a lot of flak for just underperforming compared to everything else in the market, including Bitcoin, including any altcoin that you can think of. And yet ironically, the one time where it has outperformed the markets is when the market is really bearish. For example, in the last few months when everything dropped by like 90%, Ethereum dropped by 50. And that's kind of like the purpose and the whole identity of Ethereum. It's not going to gain a lot, but doesn't drop a lot either in really risky conditions. Although I think that might be about to change because if you take a look at this Ethereum setup right now, this is the live chart. Recently we have swept the previous high and dropped right? So we were targeting the range low in this case right here. If we take a look at where the accumulation sort of happened, we can see that we're approaching a swing low. I'm going to talk about this more on the chart later, but we're approaching a swing low right now, which is potentially setting up for a classic accumulation, manipulation, distribution type of setup, with this being the accumulation, this being the manipulation underneath these swing lows, I think, and then a distribution towards the upside. This is a setup that we see time and time and time again. For example, you had it once more. You can treat this as the accumulation, this as the manipulation, long manipulation, and then eventually you distribute it for a 2x return. That's the setup on Ethereum at the moment. So the reason being is because you have a very interesting setup or similar setup on Bitcoin at the moment where you have the quote, unquote. Well, in this case, this would be the accumulation with the dis manipulation and then the ultimately distribution. Ultimately this ended up becoming the new accumulation with a manipulation underneath these lows back into the original kind of manipulation and off you go. That's the, that's the point where it kickstarted bitcoin to like $70,000 back in the 2021 bull run. Right now, I don't know if you can see this, but it's looking eerily similar where you have clearly swept some lows. Right now you're heading back to the original. You know manipulation before distribution. So now I'm going to show you on the chart how you can play this basically. And to do this, let's go back to the Ethereum. And this is the swing low that I've been talking about. So if you mark this out, previous swing lows and swing highs in the markets tend to act as liquidity, right? Draws on liquidity, meaning the market is always targeting some sort of liquidity. For example here, after Price took out these highs, it went to target the range lows. In this case, it would be these relatively equal lows down here. And the market is just constantly doing this. After you sweep out these lows, boom, what happens? You target the highs, right? And right now when you sweep once you sweep out the lows, plus the fact that you're in a range deviation at the moment, plus manipulation, you can only guess what's going to happen next. I'm not saying that this is going to be 100%, but there is a pretty. If his like history doesn't repeat, but it often rhymes and if that tells us anything, it's looking. Let's just say that the bottom is getting really close for Ethereum at the moment, or at least that's what I believe. So this is exactly what you want to look for. Firstly, I don't think you are going to pump at any point before you at least come back into 1750. Why? Because this is a bullish order block right here and this is on the weekly chart and currently you're stopping just shy of that level. I do think that the fact that you leave behind a relatively equal low here right before filling in the order block kind of, you're kind of, kind of misleading. And the fact that right now you're stopping just shy of filling in the order block smells a little bit fishy to me. Although by, you know, official, like, let's say, well, unofficial definitions, you could potentially draw the order block at the high of this candle right here. And if you go by that definition, yeah, you can say it kind of already filled in. But personally I wouldn't be surprised if we spend another couple of weeks just chopping around at the bottom here, eventually filling in 1700 and potentially going down to 1500. Not saying that it's going to go to 1500, but don't be surprised if it does. And in that case, especially if you sweep out these lows here, this will be absolute picture perfect, kind of like a setup for Ethereum. And if you take a look also on the weekly chart, you have some kind of a supply demand zone. So a supply zone is characterized by a sharp drop followed by kind of like an indecisive period before a sharp pump. So this makes this entire block here actually a demand zone. And this type of setup does not appear in the markets very often, but when it does, this is one of the highest probability setups that I have had the pleasure of learning and trading. So a return back to this demand zone will add up with the idea that we can expect some kind like this entire period right now, starting last week. The moment we swept underneath the previous lows here is already started, the manipulation zone. So you can even say the manipulation has started at this point. Right now you're at the range lows, you're swept below the range lows. This means that this is range deviation. And usually what happens during range deviation is you go to the other side of the range. And I know that in terms of ethereum it is not looking bullish yet, at least on the week. Like if you take a look at grand structure, right, super huge structure, you haven't broken past the previous all time high, which makes this technically bearish. But yet the higher time frame chart is, you know, it's so high time frame that it can be a lagging indicator. And so we try to pair what we know with current market conditions to come up with, you know, a more accurate and faster analysis. And one of the ways that we're going to come up with that is to take a look real quick at the M2 money supply. So one of the interesting things about crypto is that it tends to follow the M2 money supply. You can see that the top of the 2017 bear market kind of coincided with the drop in terms of M2 money supply. And this has generally stayed true for every single burund. In fact, this will stay true for almost every single risk on asset that you will ever see. Why? Because the more money you have in the global system, obviously the more money to go around to go into stuff like bitcoin and crypto and your stocks, your indices and stuff like that. And obviously as the money supply goes down, it makes sense that, you know, crypto can dump. So this tends to be slightly of a lagging indicator, which means that a, the point at which crypto tends to move like this cause of like a three month gap between, you know, M2 money supply and crypto. And the M2 money supply started going up starting at January of 2025, right? That was the bot quote, unquote. Bottom, if you can zoom in on that when you, during the editing process. And this is when it started going up. Bitcoin so far has been lagging for like two to three months. And right now money's supply is going up and we have reasons to believe that it's going to continue going up, at least for the medium term. So crypto also has a fundamental reason to follow along with this pump in money supply. And right now Trump, we all know that he has been taking drastic action to like one of the things you guys need to understand about the US market at the moment is that they have about $7 trillion of debt. So I was actually going to start explaining about the US debt market, but I think this guy sums it up way better. The US government has about $7 trillion of debt that they need to refinance in the next six months. There is no way the President wants to refina it at the current 10 year bond yield rates. And there is no way this is going to be lucrative for the US if they do it at the current 10 year yield rates, which is why he's trying to crash the stock market and pump the bond prices. As bond prices go up, yields will come down and the US government will be able to refinance the debt for cheap. Not only that, but the lower bond yields will, this is the part that is relevant to us, will push the Fed to do rate cuts, which is very bullish for risk on assets like crypto, like bitcoin. Whenever we go through a phase of rate cuts, crypto pumps like absolute crazy. And this pairing it up with, you know, the M2 money supply, pairing it up with the higher time frame charts, pairing it up to the fact that right now the fear and greed index is literally at all time highs. Pairing that up with the fact that we had, I, I think I saw this tweet earlier today, but we had one of the biggest liquidations in all of crypto. This was the Celsius N3AC collapse back in 2022. This was the FTX collapse. And yesterday or like a couple days ago, we have, you know, pretty much one of the highest liquidations of longs period in crypto or like in bitcoin's history. And so all of this pairing it up, like guys, micro, we're definitely playing it really cautiously in the sense that, you know, that's why I'm making these daily videos just to share with you exactly what to do on a day by day basis giving you guys the setup. We were right on bitcoin yesterday. We were right on Bitcoin last week. And we're playing it cautiously in the short term, but guys, long term, macro wise, super bullish. These are the times when generational wealth is made. I know you might not feel good about it. I know a lot of people are down a lot right now, including myself, by the way. Like, even my bags are down by a substantial amount. It is what it is. It's crypto. It's, you know, for every up we get, we get a similar, you know, drawdown in terms of, to the downside. And it's just a part of the game. Despite how you are feeling, what you cannot deny is that if you're feeling this way, chances are 10 other people, maybe 100 other people are feeling this exact same way. And this is exactly the catalyst that we need in order to form a generational bottom on crypto. Currently we're at that phase. So macro wise, don't lose sight, don't lose hope. We're very close to the bottom already. Now we just need to play this really cautiously over the upcoming, you know, two, three, four weeks at least until we get into Q2 April, which is, which tends to be a really bullish quarter for crypto and risk on assets in general. Right. Q2, Q3 are periods where crypto, especially bitcoin, tends to outperform every other quarter, basically, and every other month. So what you want to see from the market at the moment is that right now what you need to understand is that you are in bearish order flow until proven otherwise. Which means that just because we have some kind of a bottom level already set in place, and we have a level where we would love to see the market return to, it does not mean that the market will just stop right here. What's important is that you want to see some kind of bullish weekly candle close. A bullish weekly candle close followed by a second, this weekly candle close. And especially if you are able to break above this high right here, this will confirm that the state of delivery has changed and that we have now switched into bullish order flow. Now, immediately, you might be wondering, holy, this is going to take, you know, weeks on perhaps months to confirm you're right. And that's why we're going to do this on the daily chart, to just to get a quicker confirmation. Now, chances are we're not going to go below the daily chart because that will introduce a lot of noise. The daily chart is kind of like the minimum, higher time frame that I would start looking in terms of higher time frame confirmations. And what we want to see, first of all, downside, until otherwise proven, I'm going to give you guys the plan for like the upcoming couple of days to the rest of this week, as well as the plan for the next two, three weeks. So first of all, what we want to see is for price to eventually start changing the order flow. For example. What is. Well, just to give you guys an explanation on what's order flow, I want you guys to understand right now that this is a bearish order block. Price trades below it comes up, gets rejected, boom. This is your first sign that order flow has shifted. Bearish again, you form a bearish order block right here. Price trades below it comes up, gets rejected, boom. Now you have validated once more, another order block. This time price breaks down, does not come up to retrace it. But right now this is your next order block to break. Price breaks down, did not quite retrace it. And right now at current price, this is your order block to break. So you're broken up. What you want to see is for price to invalidate the order block, right? You want to see a change in order flow. That's what's going to confirm to you. Even before market structure shifts, even before higher time frame, you know, yada yada, order flow, a change in state of delivery is going to be one of the first signs and one of the most sure fire signs that you can tell that, hey, you know, the momentum has shifted right now, bulls are back in control. You can say that this is the first, you know, kind of order block that you can look at. Personally, I would wait until this level is broken. So now this brings down the confirmation time from a few weeks or a couple of months down to definitely within a couple of weeks or perhaps, you know, two to four weeks. And this will make it much easier for the average investor to the average trader to wait for longs. Until that happens though, I'm still going to lean very much towards shorts because even on in terms of the four hourly chart, you are bearish as hell. Price breaks below, the order block comes up, gets retrace, breaks below. Again, currently you have an order block that you need to break through at least on a four hourly chart before you can start being bullish. But again, when we're doing higher time frame analysis, we want to focus on the daily chart. And in terms of the daily chart, even if you don't break like this one, confirming the change in delivery, at least what you want to see is for bearish order blocks to like start Forming here. But if a price to break above it and also break above this order block. But overall, again, yeah, these higher timeframe confirmations just take time. They are higher time frame confirmations for a reason. They are macro confirmations for a reason. It stands. It's pretty reasonable that, you know, these macro confirmations will take, you know, a period of 2, 4, maybe even 8 or even 12 weeks to confirm. And that's just how it is, right. We've been in a downtrend for basically the last six months. Just like how downtrends can last for months at a time. The problem that most people run into is that they underestimate how much time these macro moves tend to take. Right. People think that the downtrend is just, let's say one month or two months and they're in for a bad surprise or rude awakening when the downtrend continues on for the next three, four, five, six months. And the bags like they keep buying a dip that just keeps dipping. This is how you overcome this. Just setting the right expectations. And in terms of the macro confirmations, yeah, at least two to four weeks. Like if we're lucky, we get it before then. But don't expect a quick reversal, but don't expect things to just happen, snap just like that. Although to be fair, if the long liquidations now, the second sign that we can see even without changing state of delivery, is just some kind of a V shaped recovery. Again, you want to see price kind of do something like this if this is possible. This is not out of the books. If this happens. That's almost like that's one of the best signs that we could possibly have for a reversal pattern on Ethereum as well as most of crypto. What you want to see then is just price to retrace into. Let's say we draw the range here at 50%. It retrace back into the 50% and off you go. That is your start of the uptrend. This comes after capitulation. Everyone has been liquidated. Right now you're swept below, you know, range lows, macro range lows. Right now you're in some kind of an AMD setup where you're, this is the manipulation phase. Plus the fact that if you get a V shaped recovery, it means that the bulls are back in power. You have interested buys at these levels pushing price higher. And especially if price retraces back into this level and holds and forms a new higher high. Boom, guys, the uptrend is back. We're back in the bull market. Alt season is about to start M2 money supply fear and Greed Index. Trump wants to refinance the bond rates. Trump is trying to get the Federal Reserve to cut the rates so that risk on assets can pump. Guys, these are bullish times to be in crypto. I know it doesn't feel that way yet, but the money's made before everyone has started feeling happy, started feeling optimistic about crypto. This is peak fear and as the wise saying goes, buy fear, sell greed. If you watch until this point in the video so far, if you enjoy analyses done on the crypto markets from a smart money perspective, drop a like and subscribe. Stay tuned for more updates. It will be coming every day. If you want a free trading course delivered straight to your email, free by the way, click the first link in the description box below, but otherwise I'll see you guys in the next one. Bye bye.










