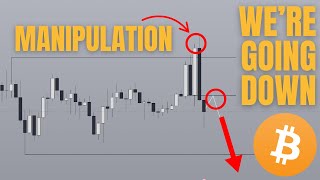
Bitcoin analysis from The Art Of Crypto. The speaker sees a weekly bullish bias but expects near-term retracement toward 100,000-101,300 unless price breaks above 106,400. They cite an 80% win rate on tracked calls and warn against counter-trend trading on 5-minute charts.
Questions this video answers
53 out of 66 calls (~80% win rate).
From $107,000 down to $103,000 (a $4,000 move).
Approximately $101,300 (also mentions revisiting ~$100,000).
Price would need to break above $106,400.
May 19, 2025.
Chapters
What's good, guys? Welcome to another week just for means, another new fresh five days to potentially make some money in the markets. So last week I told you guys that bitcoin was looking pretty choppy and to not look at bitcoin because this is what we ended up getting. Pretty great call. I'm not going to count that as a win or a loss though, because this wasn't really like, I wasn't giving you guys trades or anything. I was just telling you guys, like, it's probably not the best day to trade bitcoin. And the reason why I mentioned these calls is because since I started tracking these YouTube trades since February, we are now 53 out of 66, which puts us roughly at about an 80% win rate. So to those of you who are new to this channel, I think you may be at the right place because I tend to be right more often than I'm wrong. And for those of you who have been following along, guys, I read all of the comments and the support that you guys have been giving so far that's kind of been building up over the last couple of weeks has been amazing. Just know that I read each and every single one of the comments. I don't always have the time to, you know, go reply to each one in a timely manner. Right. I eventually do get to it. But like in a timely manner, not. Doesn't always happen. But just understand that I see you, I'm reading it and thank you so much for all the support. It truly means a lot to me. And now let's get into the update on bitcoin now that we're at the new week. So of course, you guys know how it goes. We always start things off on a higher time frame because if we don't, we're going to get caught up in all of the lower time frame noise and then, you know, we're just going to get confused, essentially. And so kicking things off on the weekly chart, because it's a new week, last week's weekly candle closed Bullish. And we left behind this further gap right here. Which means that if Price were to retrace into this further gap this week, we would still have reason to see Price go up. The reason being that a bullish candle close means that the next week's bias tends to be towards the upside. And the only concern here is that the previous weekly high has already been swept. Which means that, you know, this week could just end up being a retracement week before next week or maybe the week after gives you that kind of, you know, trend continuation. And speaking about trend continuation, so far you are still within a bullish trend. If you take a look at the weekly chart, that's high, low, higher, high, higher, low. And so far we are still on route to taking out this previous high right there. And I think that until you take out this previous high, you are not going to start giving a full on market reversal and go back into a bare market. Of course, all of this can change with one word out of one man's mouth, and that is President Donald Trump. Right now, the fate of the entire world's markets kind of lies on his shoulders. And so with one word, with one decision by that man, things can change immediately. And so we may just, you know, leave behind relatively equal highs here. But still, take my words with a grain of salt, just understand that this is not something that I can anticipate, but I can tell you to kind of account for it, right? This is always a possibility and that's what we do with environmental factors at the moment. Weekly bias is bullish. And right now there are two ways that this week can go. One is that this ends up being a retracement week before next week we start going up again. Secondly is that because today's only Monday and we've already had this kind of an aggressive move, right? We went from 107,000 this morning to now sitting at 103,000, right? We've lost $4,000 of, you know, price action in terms Bitcoin within just the Asia session of today. And that means this week's kicking off pretty volatile. And if we can have a similar level of volatility heading into the rest of the week, then there is a very good chance that you can also, just within the same weekly candle, you will touch the low and then pump up again. And this will pair up with the concept of a power of three, which essentially, if you are bullish, right, you want to look for the weekly open, right? This level right here is the weekly open. Any current price, you know, goes below the weekly open, gives you an opportunity to buy low, to eventually sell high on the expansion towards the upside. And then maybe this will become your weekly close. So that's the kind of setup that we can potentially play today. Although going into the daily chart will probably give us a better idea. In fact, before I go into the daily chart, it'll be amazing to check out the news that we have in store for this week. And basically today there's no news, tomorrow there's no news. The Day after there's no news and it's not until Thursday where you have red USD news. In fact, Friday is not going to have news as well. This week is shaping up to be a non, you know, kind of this week actually has very little news. And this is a little bit of a concern mainly because when like I always like to say that there are always three variables when it comes to trading. One is kind of like the direction of price. Is it going to go up or is it going to go down? The second is how far up is it going to go and how low is it going to go. And then the third variable is that when will all of this stuff happen? It's very tough to make right calls if you cannot kind of narrow down all three variables. The benefit of having news is that news events are always events that bring volatility into the market. Which also means that during news events you can kind of focus on just the first two variables. Right? Where's price going to go and how far? Because the time aspect of it can be kind of narrowed down. With news you're pretty much certain that at 9:45am on Thursday you're probably going to have volatility. It's just determining when in which direction that volatility is going to go. So this week we do not have news. And so it wouldn't be surprising to see price just kind of chop around. Could be a very real possibility. Again, I don't know how this is going to play out yet. So we're just going to take it day by day. And that's why you guys are subscribed to this channel. If you guys appreciate these types of analyses done from the smart money perspective on crypto, then make sure you subscribe because I'm coming to you guys with pretty much daily videos. As long as there's something to talk about, I'm going to talk about it. And taking a look at the daily chart yesterday, closed bullish doesn't really quite mean anything though because currently price action has already given a change in order flow it your lower time frames. What's still important to keep in mind is that you have relatively equal lows here, which by the way, I anticipated this low to get tapped last week. Right? And this is what I talked about before. I know for a fact that this low is going to get tapped because you have left behind relative equal lows as well as a weekly F gap right underneath those lows. Problem is I don't know when that will happen. Right. And that's kind of what news gives you. And when you do not have news, it's very tough to tell like when this is going to happen. And so last week I predicted last week, but then there wasn't a lot of news last week. And so guess what? We're now into next and hopefully we're going to get that level hit this week. So going down to the 1 hourly chart, because there's not too much to talk about on the daily chart other than the fact that this is currently the draw liquidity, which means, yes, you will expect, you will anticipate Bitcoin to go all the way back down to $100,000 before any kind of like upside reversal. The reason being right now you have just swept the range highs, right? This is the range highs. So this is the range high. You swept the once and then immediately you sweat, you sweep it again. Now the sweep actually doesn't matter. Now what's more important to note is what happens after that liquidity sweep. And in this case, right after you get the liquidity sweep, boom. That is your change in state of delivery, which means that the order flow on the one hourly time frame has now shifted into bearish order flow followed by a break in market structure. So this is what's known as a broken base. So right now you have two different types of reversal confirmations, one in the form of the CISD and the other one in the form of a broken base, Both of which are very high probability kind of reversal patterns. And so this is something that you want to be cautious of. And from this, from the fact that most of the buy side liquidity, in the sense that the range high has already been swept, it means that there is no longer much reason for price to just pump straight up to take out some other, you know, buy side liquidity. Because we could zoom out. There is really not much right now. You've taken out this high right here. And let's see if we've taken out this high. Yes, this high has also been taken up. Maybe you can say this high right here. But like, but guys, the fact that you have swept liquidity followed immediately by a change in state of delivery as well as a change in market, market structure, that's kind of like the tell that, hey, the market is telling you right now that it kind of wants to go down and super important to actually read what the market's trying to tell you rather than hold stubbornly to the bias that we have. And I think that's something that we're pretty good at, which allows us to, you know, get an 80% historical win rate across publicly tracked calls. It's just being flexible and reading what the market's telling us instead of, you know, having a bias and just sticking to it. It's also like, some people tend to complain, like, oh, you know, this guy talks about multiple scenarios. Well, guess what? I don't know what's going to happen. It's not the job of a trader to predict what market's going to do. It's kind of like painting different scenarios. And once, like, let's say scenario A, B, C, right? A, you have three conditions. B, you have three conditions that needs to be met before that scenario is validated. Like, all it comes down to when you're on the charts and when you're actually executing trades is just you're waiting to see which conditions are fulfilled and which scenario is happening. And based on whatever scenarios that's happening, you kind of just take a trade, right? It's a game of reading and reacting rather than trying to predict what's going to happen. Going back to what I was saying, you have a change in order flow after sweeping out all the highs. And right now you've also changed the market structure. So today, if there is a trade today, it's probably going to be a continuation trade. And I think that price is going to keep going down until we hit at least $100,000. And that will be play by play, you know, kind of day by day situation. And right now, London has broken cleanly out of Asia, which means that if you were to retrace into any sort of PD array, in this case, on the one hourly chart, you have this PD rate right here, That's a favorite gap followed by a weak high, which means that if you were to sweep above this high, that's what I'm going to be looking at. If you sweep above this high, right, Sometime during the London session, sometime during the New York session, you want to look for a continuation in order flow towards the downside. Now, essentially the trend for today is already set, which is towards the downside. Right now we're just looking for some kind of retracement to ride the wave lower. Now, don't get me wrong, one thing you should not anticipate is that because the range around the Asia session was so volatile, like you have 107 to like 103, right? This is a $4,000 range, which means that I'm willing to bet that a lot of the daily volatility is already put into place, which means that for the remainder of the move today, you may expect today to just maybe hit, you know, 101.5 or maybe even 101. Maybe you might hit the further gap all within today, I don't know. But what's important to understand is that the setup remains the same. You're looking for some kind of retracement. For me, I'm going to be looking at this further gap right here. If this happens sometime during, let's see, as of the time that I'm filming this is 3:30. If this happens anywhere between now and like 7:00am Then you. And if price also shows a willingness to start going down, then boom, you just write a continuation trade. Lower target is going to be this low right here. I do think that because this is a weak low that you are going to get targeted. And also the fact that you are in a downtrend. Secondly, you have this previous low over here on the one hourly chart. So that may be the target for today. 101300. If it happens, great. If it doesn't, you guys have a area where you can take profits at. I think this is going to be the trade for today. Now for the ones looking for a bullish trade on Bitcoin, like sure, you may get something on the five minute chart, but the problem here is that on one hourly it's bearish, right? And it would take Price breaking above this level right here, at least for now, at least based on fair price. Price would need to break above 106, 400, right, to confirm any sort of bullishness. And so in this case, Even if your 5 minute chart were to tell you it's bullish on the higher time frame, you know, you're basically counter trend trading, which is not what we're trying to do. We're trying to trade with the trend, not against the trend. And so yeah, you can argue that hey, you know, if this order block whatever gets closed above and price comes to find support and price starts going up, yeah sure, you may be able to capture like a small move like this. But just remember your higher time frame trend is towards the downside. And when it comes to that, instead of trying to, you know, counter trade fomo, trade the counter trade opportunity, you may as well just wait for price to retrace properly jump into a trade and be able to capture this large move instead of like a baby move like that where your probability is lower, your win rate's lower and the overall like magnitude of the move is also lower. And lastly, let's just refine it down to one more favorite gap because we also have one more right there. So if price retraces to either one of these February gaps, just look for some kind of bearish order flow breakdown on the five minute chart or your lower time frame, whatever lower time frame that you're using. Once you get that, then yeah, it's just an easy continuation trade this, this right here. And yeah, pretty straightforward right now. There's a lot of uncertainty in the markets so make sure you subscribe because I'll be making more videos just like this. Just giving you guys the objective facts of what I think is going to happen. No fluff, no bs. I'm not trying to show you guys on some coin or whatever. Clean trading hopefully at its best. And yeah, if you guys want more value just like this. I'm sharing a lot of lessons inside my newsletter pretty much daily. Actually you guys are interested first thing in the description box below. Otherwise I'm going to see you guys in the next one. Bye bye.










