orderblocks, CISD and liquidity (what they are and how to trade them)
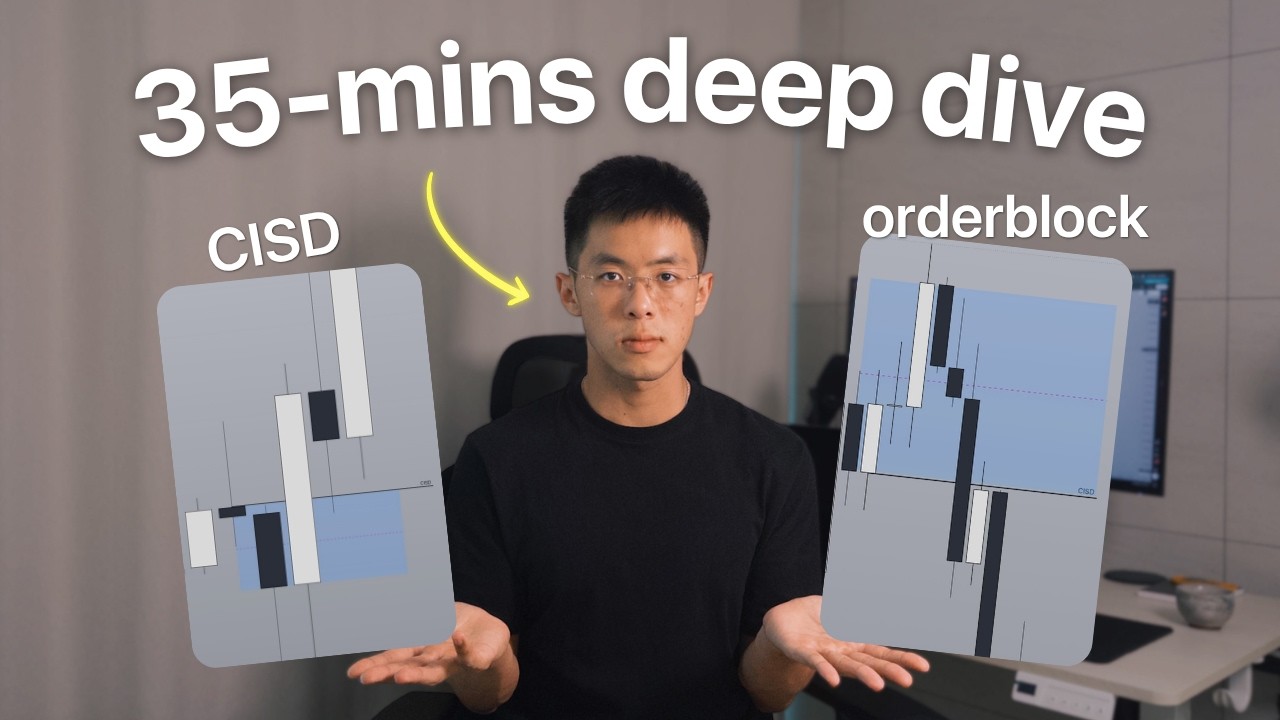
The Art of Crypto creator teaches order blocks, CISD, and liquidity zones for institutional trading. Order blocks are drawn from candle bodies, not wicks. Internal liquidity includes fair-value gaps and order blocks within range; external liquidity refers to swing highs and lows that act as stop-loss targets.
Chapters
Hey, so I'm literally just about to get into answering some beginner questions from a brand new student that joined the program. And when I say beginner questions, I genuinely mean that this person, Pete, is an absolute brand spanking new beginner who, like for example, one of the questions he asked here in this series of questions is, what is a down close candle? Or what validates an order block? And some of the questions here is, hey, what is internal range liquidity versus external range liquidity? What is a broken base? What validates, or for example, what determines the candle at which to base a CSD? So yeah, I'm going to answer these questions. Just thought that I would record myself doing it so that I could post it on YouTube and maybe you might gain some value from this. But yeah, let's go, let's get into it. Hey Pete, so just going to start answering your questions, starting with the first one, which is what validates an order block, right? Which basically just means like, what is an order block? And to answer that, I think we can just start with the official technical definition of what is an order block. So an order block is simply last candle or series of candles that are going in a certain direction before they get impulsively closed through towards the other direction, right? As an example, a bullish order block is a candle or series of bearish candles that gets aggressively closed through. So this now becomes a bullish order block. Now on the flip side of the equation is a bearish order block. So a bearish order block is when you have a candle or a series of upclosed bullish candles that gets closed through. So for example, these 3 candles are the final upclosed candles before they get aggressively closed through towards the downside. So now this becomes a bearish order block, drawing it here, bearish order block. So when it comes to order blocks, one very important distinction to make is that you want to draw in at the candle bodies only. So for example, you wouldn't use the wicks, you wouldn't use the wicks, you would only use the candle bodies of those last series of candles that got closed through. So on the bullish order block side of the equation is, for example, this could be the order block, right? Notice how I'm only drawing it on the candle bodies. This is also an order block. And one of the things you will immediately start to wonder is, hey, isn't there just like a, you know, one candle or like 2 or 3 candles? Or like, because sometimes it could be 5 or 6 candles, sometimes it could be, for example, this entire block right here is an order block. Yes, amongst all of these little blocks right here, you have a bunch of smaller Bullish order blocks. So that is where, like, I see most of the confusion from new students come in, which is order blocks are a little bit subjective in this way. And this is something that is super natural to be confused about, especially at the start. But as you continue to gain a bit of practice and understanding, it's all going to click and it's all going to make sense. So the way that I'm going to explain this is that all of these are all valid order blocks. As to which one you're going to use, it depends on the situation and the context that you're in. For example, if right now we are in I don't know, 8:30 AM and news is about to drop. And let's say at this point we are only at this candle right here. Then knowing that we are about to enter the news, it means that prices are likely to start accelerating soon, right? Whatever move that you're forecasting or whatever move that you're looking for, chances are it's going to happen pretty quickly. So at that point you would be a little more aggressive, right? Now that you have this order block confirmed and you have this order block confirmed, you're just literally going to start placing a limit in this order block, placing the stop below, and just using that. Now, in a situation where, for example, you have no news and you're kind of in between sessions, or like the timing is just not quite confirmed, or if, for example, the market is otherwise in an overall downtrend, you're not quite sure if this first bullish order block that gets formed right here is the order block that you should take, then you would wait for a bit more confirmation by waiting for a bigger order block to form, because this gives you way more confirmation. Like this is way stronger compared to something like this where you could just end up getting faked out where you take the order block, but then price kind of continues going into a downtrend. That's the way that I'm going to explain it. As for like when to use what, like a lot of people tend to get over-analytical about this and they try to be very perfectionist about this whole process. But the truth is it's something that like definitely comes with a bit of experience. But honestly, this is a skill that gets improved as you gain more experience in the markets. Once you've seen more price action play out, you're gonna get a much more natural feel as to which order blocks to use and how to draw the order blocks. But overall, like these are all you know, valid order blocks. For example, um, this right here is a valid order block because this is literally like this entire thing. But it doesn't need to just be this right here because an order block is also fundamentally— if we really want to dive deeper into why order blocks work, they are institutional levels of accumulation or distribution. So what does that mean? Accumulation literally means that they are building up long orders so that they can, you know, eventually pump the markets, right? And distribution is that eventually you hit a point and they're looking to sell. They cannot sell all at once, right, because they're dealing with very large So they're going to distribute it throughout a certain period of time and they're going to distribute it within a certain range. Now, eventually though, both of these accumulation and distribution stages, you're going to move out of them eventually, right? And assuming that there are a lot of smart money traders that have not yet kind of filled all of their orders, guess what's going to happen as price comes back into that previous area of accumulation? That's right. There are going to be a ton of resting orders over here where the moment it taps into it, kaboom. Off you go. So this is what makes order blocks really strong levels for support/resistance, right? In terms of bearish order blocks, it works the same. Distribute, but then price eventually explodes out of it. Oh, I haven't filled all of my orders. So you can have a bunch of limit orders over there. As price returns back into the bearish order block, you're going to have a pretty strong reaction. So it also stands to reason that when it comes to order blocks, ideally you don't want to see order blocks where— let's use this bullish order block as an example. This is the 50% line over here. That you can see on my chart. The 50% line is just a fancy term for saying the midpoint, right? It's the midpoint of the order block. So this order block again is drawn this low to— actually, it's supposed to be this high, right? Just to keep it clean, this low to this high, because that is the candle bodies of the down-closed candles. The best order blocks never go beyond the 50% line because it tells you that as price is coming back into here, the hypothesis is that there are going to be a lot of resting buy orders for which price can kind of move out of. If you happen to come back into the order block and there happens to be a lack of, you know, just bullish price action, it kind of tells you— or it's a warning sign— it tells you that maybe there are not as many interested buyers as you initially guessed. So as you get closer and closer to the midpoint, or if you go below the midpoint, that again tells you that maybe this order block isn't as strong as you think, or potentially it could just not be an order block, period. And so The best order blocks are always ones where they— like, price action just kind of explodes out of them. Uh, pretty straightforward. I'm going to try to look for an example to show you exactly what I mean. Like, for example, right here. Like, I'm gonna pause this video right here for a moment, and I want you to tell me where you see the most recent relevant order block, right? Just to confirm, I'm gonna zoom in on the price action over here. And what do you see? All right, if your answer is, for example, this one, you'd be correct. But when you have— when you run into a situation where you have a smaller order block within a larger order block, like, it's again, whether or not you should use the smaller one or if you should use the larger one depends on the situation. If you're anticipating that, you know, you're in a very good timing and price is about to move soon, then you can use the bigger one to kind of get an entry. Your stop loss in this case is going to be wider compared to if you were to use this one, right? But it actually ensures that you will get an entry rather than missing the trade completely. But in this case here, I would be using this order block. And as you can see, as price is coming back into the Order block, you don't really go beyond, but you never get close to the midpoint, and off you go. Now obviously it's going to need another couple of hours to see if this will actually work out fully, but this is kind of what you want to look for when it comes to good order blocks. Now in terms of bearish order blocks, it's also similar, where for example right here is a bearish order block, this entire series of candles, right? Again, remember these are institutional levels of, or areas of distribution, so it doesn't need to be just a single candle. Like sometimes if you get a range, for example, or if you get a lot of price action just within a certain range, then that is going to be much stronger because it tells you that there was a lot of trading that went on between these levels. And as price eventually explodes out of it, once you get back in, you have those open limits and down you go. Now, obviously in this case, you did not go fully down because of other factors. Like you still have to take into account the overall order flow. What is the daily bias? What is the hourly kind of order flow and stuff like that? But you get the idea. So as you head into this order block again, take a look. If it's a good order block, you're going to come in and you're not going to spend too much time in there. Now, the other question that beginners tend to have for me is, you know, how many taps is, you know, too much for an order block? And to be honest, 1, 2, perfectly fine. More than 3 is when I would start to get concerned sometimes. And I know these are just like a couple of candles that kind of taps into the order block. Sometimes it could be 1 tap, 2 tap, that's still fine. But if you tap into it a 3rd time, like it kind of tells you that maybe the order block is not as strong as you initially thought, because again, it ties back to understanding What is an order block? The order block is an institutional level of distribution or accumulation. Assuming that smart money is actually interested in dropping price from this point onwards, you shouldn't need to revisit this multiple times or to kind of do another distribution within the order block, if that makes sense. If it's a good order block, price tends to be pretty aggressive. It tends to be pretty straightforward and it tends to be pretty clean. Those were examples of like a series of down close candles. But honestly, even something like this could be An order block, right? Again, it's just the last down close candle before an aggressive move towards the opposite direction. For example, this. If you use this order block to trade, placing the stop at the start of the order block and placing it— there are stop loss beneath the order block and just targeting for 2R. Literally, this very next candle comes into the order block and off you go, right? This is a prime example of an order block can be small. It can also be big. Obviously, the big ones will give you a little bit more certainty, but doesn't mean that the small ones are invalid as long as you're using the candle bodies and as long as you understand what order blocks. Are you gonna be fine? That's question number 1. To move on to, like, this is honestly a super much more in-depth video than I was initially expecting, but hey, that's probably power to you. What determines the starting candle for a CISD? Now I like how that is the second question that you have because it segments naturally from this explanation of order blocks. So the CISD is when, like, the way I like to define it, right, is when you get a situation where you have bullish order blocks being respected. This means bullish order flow. To eventually bullish order blocks start to be disrespected, then you start seeing bearish order blocks get disrespected. Sorry, that was a bit of a mouthful tongue twister. So the moment at which you change from bullish order flow to bearish order flow, that is your CSD. So when you are like drawing out your CSDs, you're going to be using order blocks. So for example, over here is very clearly price is going bearish, right? And when you are bearish, You want to start looking at order blocks. So, okay, once you're at this point right here, you would anticipate this bearish order block right here to hold as resistance. The moment that gets disrespected, that is known as a change in state of delivery. It's the point at which this entire down move right here, bearish order blocks were getting respected, but eventually it stops being respected. And that point at which it stops being respected is the point at which you mark your CSD. So this is an early CSD. Notice how price comes back into the CSD. And off you go. And in this one right here, your CSD is also only using candle bodies. You are not using wicks, just like order blocks. You are not using wicks because CSD is based on order blocks. It also means that you're not going to be using wicks for CSD. Now, this is an early CSD right here, right? It basically just means the first CSD that occurs. But sometimes that first CSD might not be the one that you actually want to go for because, for example, the market has been pretty bearish so far. Sometimes you may feel a little bit uncertain as to jumping into the early CSD because it feels like, um, What if you get faked out here and price just kind of dumps? So at that point comes the thing that I kind of invented, which is, well, I don't want to say invented, but I've not really seen other people talk about this, which is the undeniable CIST. So if this is early, undeniable simply means that, okay, at what point are you going to be super confident that the market has definitely shifted now? Like for example, in this undeniable CIST here, not only do you break through this bearish order block, but you break through this huge one as well. And at that point it's like, hmm. I don't think there's a lot of doubt remaining that the market has now shifted into a bullish kind of order flow. Now, as you can see right here, I know I'm just cherry picking a little bit, but generally this is how I think about using CSDs and differentiating between undeniable and early CSDs. So that is the subjective definition of the undeniable CSD, which is at what point on the chart does it become much more undeniable that CSD has occurred? Now, this can be a little bit more subjective. So for those of you, well, for For the people that like to get really, you know, minute with the details and like exact technical definitions, an undeniable CSD can also be defined as 2 consecutive CSDs. So for example, this is the first one, and the second one would obviously be here because this is your first bearish order block and this is your second bearish order block. So once you disrespect the first one, that's your early CSD. The moment the second one happens, that's your consec— that's your second consecutive CSD. And like, yeah, that becomes the undeniable CSD. And the way that you use CSDs and order blocks are very similar in a sense where You know, once you get the CIZ, you would play like with an order block, right? You would place your entry at the start of the order block and you would place your stop loss at the low of the order block. In this case right here, like once the CIZ happens, this entire block right here now becomes a bullish order block. If you manage to catch that, congratulations, it means that you are now understanding order blocks better. So in this case here, the way that I would use the undeniable CIZ is to just place the entry at the start of the undeniable, place your entry at the end of the undeniable. Now, in the event that you're using the early CIZ, then you would place your stop loss here. Why? Because the moment price closes above this level Right here, this now becomes your new bullish order block. So as price comes into here, place your stop loss below and you target for 2R. So this is how you use CSD and this is how you determine at what point does the candle kind of confirms the CSD. Now in both cases, as long as you understand how to draw order blocks, or if, as long as you understand order blocks really, that's most of the way there. Hey, by the way, if you're watching until this point of the video so far and you're liking what you see, and if you'd like to work one-on-one with me where you can learn this full system under the direct supervision of me and the team, where we're gonna make sure that you're gonna do every step The right way and make sure that you're never kind of lost in translation. And for example, you might think this is an order block, but in reality it's not. Or like, for example, if you like, you think this might be an order block, but your entire definition or understanding of order blocks is completely wrong, then that is exactly what we do inside our one-on-one program. And beyond just the boring stuff like, oh yeah, we're gonna help you make sure you learn things the right way. Like, what is this actually for, right? If you're trading, chances are you're doing this for a reason. For me, I started trading because I wanted the freedom to be able to work from anywhere and whenever, like as much or as little as I wanted to. Currently I'm doing that. Now, this is not exactly the best kind of view because I'm literally like smoking a cigar while I work answering, you know, these student questions right now. But still, I show you that background, not necessarily to focus on the background, but to tell you that I've been full-time traveling for like the last 3 years while just sustaining a very good living from trading and basically living the life of my dreams. And for a lot of you watching this, I assume that's the reason you get into trading for. Now, if that is the goal and you haven't gotten there yet, then chances are you've been putting in the work into trading, but you're just not seeing the results that you know you should be seeing. Now, chances are if that is the case, it's because you don't have guidance and you don't have coaching. You don't have somebody who's already achieved the things that you want to achieve, or just somebody more experienced than you, or I don't want to use this word, but like an expert. I don't consider myself that, but just somebody a little bit more experienced to point out to you, hey, this is exactly what you're missing. This is exactly what you're doing wrong, and here's how to fix it. This is something that we've seen time and time again get people from years of breakeven or just years of frustration or just getting stuck to getting funded literally 2 months later. And case in point, I've worked with about 60 people so far in this one-on-one program, and about 32 of them are currently funded or full-time trading already, which means that we have a success rate That no other program can claim. And why is this the case? Because we're working with you directly and we're very hands-on and we're very involved, which is not the case for most of the programs out there. So if you're interested to finally like accelerate the pace at which you're getting results, just to get to that point where you can actually start living with options rather than getting stuck in whatever you're doing right now, click the first link in the description box below and book a call and we'll speak soon. So let me know if you have any more questions regarding that. But now let's go into the third question, which is, what is the New York-London Asia manipulation, distribution, accumulation mean? Okay, so this basically just plays on the idea, like there is this concept known as quarterly theory. Now when it comes to quarterly theory, the general consensus is that the Asia session, which is this red box right here, Asia session tends to be accumulation. The London session, which is right now, as you can see here, LOKZ means London Open Kill Zone. Right now we're in London. London tends to be manipulation and New York tends to be distribution. So the way this tends to play out Let me see if I can go onto a chart that is playing out exactly. Yeah. Okay. So this is a prime example of how manipulation looks like. Asia's accumulation. Today we have a bullish daily bias, which means we're supposed to be looking for longs. Now, when we're looking for longs or when we're trading in the London session specifically, we actually want to look for London to trade below the Asia session, especially if we're on a day where we are looking for longs. And the reason why this is called manipulation or the reason why London is oftentimes associated with manipulation is that at the start of London, you tend to see these false moves. You're clearly looking for longs today, and yet what does London do? It goes bearish at the start of the session, and then you get a sharp reversal. This is manipulation. Why is it manipulation? Because a lot of people would look at this chart right here, or at this point right here, and they will go short because they think that the market's breaking lower. This is most retail traders. But accumulation, manipulation, and distribution is a smart money kind of understanding of the markets. So what does smart money do? They tend to trade opposite of retail. So as retail or the majority of retail are going short, well, this, the better, like, you know, the smart money traders, they understand that this is just manipulation, right? It's a false move. They actually want to use this as an opportunity rather to buy low so that they can eventually sell high. And who are they buying low from? Everyone that is going short at a very terrible price. And basically like the people that are going short are basically selling low and buying back lower, right? But so the people that are all going short here are basically selling low, which is ideally not what you want to do. What the smart money do, they buy low from the Idiots so that they can sell high later. So the way this is going to work and the way that you use this information is, for example, with manipulation. Once you get the sweep of the Asia lows, you want to wait for a CISD. Now here's where I'm going to pause the video real quick. Where is the CISD in this case? So if you said it is this one, you are correct. That is an early CISD. At what point do you get a second CISD? Well, you draw the order blocks, right? This is your first bearish order block and this is your second bearish order block. Well, technically speaking, if you want to say this is your secondary short block, that is also correct. Again, it's a bit subjective, but it's also part of the, part of what makes this an art form and part of what gives you a lot of room for improvement. As you get used to this and as you gain more experience, you're going to have an intuitive understanding of when, what, which CIs to use and when they might be happening. And that's the fun of it, right? And as much as I would love to give you like a, you know, okay, this is the exact technical blueprint, it doesn't exist. And anyone who tries to tell you otherwise is going to give you a very rigid kind of framework to use in a market that is constantly Instantly fluid, which doesn't really quite work. So if you say this one, like that's also great, right? Once you get the undeniable CSD, you place this entry here, you place a stop loss here, and you target for 2R, and this would have worked out. Now on Bitcoin as well, we had a similar you know kind of situation with the manipulation where you get a minute, you get the sweep below the Asia lows right here, and then you get the CSD. Once the CSD happens, I enter this trade. I place my stop loss at the low, and I target it 2R, or in this case, I was actually targeting the Asia high. You can see both exactly similar setups. One of them ended up working. None of them seems like it's gonna stop me out, which is also a very normal part of the process. All that's important is understanding the overall setup. So that's an example of A and M. So what is D? D is distribution. Essentially, distribution refers to, okay, when you get the manipulation, right? There are a lot of traders that are already stuck here in the official sense of the word. We traders, we used to say trapped traders. What does that mean? Trapped basically means that anyone who goes short here thinking that the market was going lower, especially the You know, the dumb retail traders out there, a lot of them don't really run a stop loss. They just kind of like go manual stop loss, which is never a good idea. So what ends up happening as price continues to pump is that these traders are now stuck in red positions. And eventually if price pumps enough, they're going to get liquidated. That's what it means by trapped. Trapped meaning if they, like, they can either take a loss or they can potentially get a bigger loss, but either way they're trapped in that position. So distribution refers to, like, for example, what you're seeing right here. This is actually the manipulation and this is how distribution looks like, which is after you manipulate traders, you go the other direction aggressively, ideally aggressively. It doesn't have to always be aggressively, right? But as long as you go the other way, you're going to trap these traders and eventually liquidate them. That's distribution. So the way that these daily profiles tend to play out is that A, you have AMD, and the second daily profile is ABC. I'll mention ABC later. Like for example, just to give you an idea as to how this looks like, and looking at gold so far, it definitely looks more so like every single day has been more of an ABC. Rather than an AMD, or at least in recent price action. But let me see if I can find some solid AMDs. Yeah, not really. I'm looking through price action so far and like majority of it has just been ABCs, at least in the last couple of weeks. Okay. Yeah. So here's a perfect example of an AMD, right? If you take a look here, this is your Asia session. This is your London session and this is your New York session. London manipulates, New York distributes, or actually technically speaking, it's between the hours of London and New York. But the key point is that if you are anticipating a manip— or if you can see the manipulation, then a natural next step is to assume that that's going to be distribution because that's what tends to happen. Now, the other kind of session profile that you're going to hear about is ABC, which literally translates to accumulation, right? Asia's always accumulation. This never changes. Asia accumulation, London breakout, New York continuate. So ABC, accumulate, breakout, continuate. That's very self-explanatory in the name. But the signs that you want to look for is for London to trade the majority of its volume above the mid-range of the Asia session. So if you draw a box over here, all right, or you can draw a fib, whatever. Let me just draw a fib from the low to the high of the Asia session, the mid-range. As long as London, the majority of it is trading above the Asia mid-range, it shows you that there is a willingness to keep price above a certain level. This shows you that price is breaking out, it's staying there. And so for New York, we would actually anticipate that price will continue in the same direction, assuming this matches up with the daily bias. So ideally, even you want to see New York trade, you know, if for example, London trades fully above the Asia high, this further, like this is even a stronger signal of a breakout because clearly there is a willingness to keep price above, you know, the Asia high. Now compare this to the opposite where London sweeps above the Asia high. If this was going to be a manipulation day, then you would just kind of drop, right? You would not really spend much time above the Asia mid-range. Now, The way that you're going to kind of predict when these things are going to happen is to use your daily bias. If you are bullish on the daily bias and if London also trades above the Asia session and stays there, then that kind of confirms that price action is kind of putting in some evidence to support my theory that price is going to go up today. And so that's when you can be more confident that this is going to be an ABC. On the flip side of the equation, if I have a bearish daily bias today, it means I'm looking for shorts, right? So whenever London sweeps above the Asia, I'm actually anticipating, right? I'm looking for London to actually give me a manipulation. And if it happens, I'm going to go short. For the same reason that, for example, on Bitcoin just now and gold, I also took a gold trade. Like Bitcoin's not the only one that I took. So yeah, I ended up with one loss, but gold more than made up for it. Basically here I'm losing 1R and gold I made 2R back. But the key thing here is that because I have a bullish dirty bias on Bitcoin today, I'm looking for longs, right? So as the sweep happens and you get a CISD, you kind of assume that this is just going to be manipulation and you enter it here. But on the flip side of the equation, if I was bearish today, Then I would not be taking a long here because I'm bearish, right? I'm looking for shorts. Would actually look for London to trade majority below the Asian mid-range so that I can take advantage of some sort of a move towards the downside later on during New York. So that is ABC, right? Depends on your daily bias as to what AMD and ABC are going to be. And one thing you definitely want to keep in mind when it comes to AMD and ABC is that they are not be-all end-alls. They are not a primary indicator. It's not like you open up a chart and immediately, okay, the first thing you look at is, is price going to AMD or is price going to ABC? There are also certain days where price doesn't Do AMD or ABC? After all, price action is random, right? AMD and ABC at the end of the day is just a certain behavior of price that we've observed happens quite often in price. It happens in a way where we can take advantage of these you know kind of session profiles to make money from markets or to predict right quote unquote predict what is the next move in the markets. Even though that's not what we're primarily doing it for. So again, this all starts still from you know step one look at your daily bias. Step two look at your hourly time frame. Step three go into the five minute. It's like AMD and ABC is a bonus confluence. That you add on top of your initial analysis that gives you more confluence, right? For example, if you're already bullish for the day and you have an hourly key level over here that price is coming into, and then just so happens that London is also showing you, oh, it's manipulation, like that adds confluence. But it's not the first thing that you look for, and it's not always going to be there. But when it's there, it's great. So hopefully that answers your question about what AMD and ABC is. Fourth question, internal range liquidity is FVGs. Yes, correct. FVGs and order blocks. Now I know Sid likes to define internal range liquidity as only fair value gaps, but I like to also include order blocks. And external range liquidity, swing highs, swing lows. Yes, correct. Like just to show you on the chart what makes them different and why I say order blocks are included as well. Like it's important that you understand the actual, like real kind of reason or explanation for these concepts rather than just taking them at face value or like just the textbook definition, right? So what is external range liquidity? External range liquidity refers to the objective that the market is trading towards. We have to remember that every move in the market always has some sort of an objective, and oftentimes that objective tends to be to stop out or to take liquidity. What is liquidity? It simply means previous stop losses that are above or below previous swing highs and swing lows. For example, above previous swing highs, this is known as buy side liquidity. Below previous swing lows, this is known as sell side liquidity, right? The reason why it's called buy side, by the way, is that if you imagine that you go short at some point, if you place your stop loss above this level, when you get stopped out on your short order that happens is a market buy, and that's why it's called mark buy side liquidity. When price hits this level, there's a lot of people that are going to be forced to liquidate their shorts, and that's going to drop a whole lot of buy orders into the markets at this price. Now sell side liquidity is the opposite. If you're going long and you place your stop loss, believe here, what happens when you get stopped out? That's right. You get a market sell. That's why it's called sell side liquidity. External range liquidity refers to buy side. And sell side liquidity, where it's the external targets. And the reason why they're external is going to make sense in a bit. But just know that swing highs, swing lows are external range liquidity because that's where, like for example, if you're bullish and price is printing bullish, then you would look at this as your target, right? Your external range liquidity. Internal range liquidity refers to because price doesn't just move straight up and straight down, right? At some point, like let's say this is your liquidity right here. We're going to get in fact, let's let's use a better example. In fact, yeah, let's use a different example, right? Let's say gold. So gold, for example, if I look at this chart right here, right, I'm going to pause this here. Where do you think the external range liquidity is, assuming that gold is bullish for today? If your answer was somewhere around here, that's great, right? That's the external range liquidity. Now, if your answer is here, you are also correct. Both of these are external range liquidity. Why are they external range? It's because they are further from where price currently is. Now, internal range liquidity refers to the exact range that price is trading at the For example, this most recent swing low to the swing high. Anything in between, you know, these external swing high and swing lows are known as internal range liquidity. Now, to be more specific as to, you know, to give it a more specific definition so that you can actually use this, not just so that you can actually use this information to, you know, get solid trades, internal range liquidity refers to the fair value gaps and order blocks within a certain range that you can use as a retracement Level to get in on a trade to target external range liquidity. That's definitely not the most efficient way for me to say that sentence, but look at the chart right here and it's going to make sense. So as an example right here, right? This is a fair value gap, and I know where price currently is right now. It is also a fair value gap, right? So let's draw this out. So fair value gap, fair value gap. These are both internal range liquidities. Over here you have another fair value gap, so that's also an internal range liquidity. And then obviously you technically have this whole order block as well. Right? This entire order block. Now remember the definition of what is an internal range liquidity. There are areas of retracements that you can use to get into a trade to target external range liquidity. Now the black lines right here are external range. Internal range is simply when, like for example, when we're looking for retracements or when we're looking for entries period in this system, we're always either using an order block or a fair value gap, correct? Why are we using order blocks and fair value gaps? Because we know that they're institutional levels. Where price is likely to find support/resistance from, right? High probability areas of support and resistance. Assuming we're going long here, we're looking for support. These are all examples of internal range liquidity. As for which one to use when, that's a completely different topic. It also kind of ties back into the explanation that I gave you when it came to order blocks earlier, where like with more experience you're going to know which order blocks to use and which one to prioritize and stuff like that. But a general rule of thumb that I will give you is that when it comes to, you know, internal or external range liquidity, like draw a fib from the low to the high of that internal range, whatever that might be. If you're looking for buys, you ideally want to prioritize the internal range liquidity that are below the 50% line. So below the mid-range, this is known as a discount. Above the mid-range, this is known as a premium. Ideally, you don't want to be buying in a premium, right? Ideally, you want to be selling in a premium. So if you are looking for a short, like for example, this is your internal range liquidity, ideally you want price to come back into a discount zone. For example, like from this high to this low, that's your internal range, right? Going to draw a fib and you're going to mark out the 50% line. If you just so happen and they have an order block over here, for example, then that's the one you want to prioritize compared to an order block that might be here because that's in a discount zone within the range. So similarly here, this is your range from this low to this high. And so ideally you want to prioritize the order blocks. So for example, this order block right here fits perfectly with the 50% line of this range. So instead of using this fair value gap, which is above the 50% line, again, you ideally don't want to be buying in a premium. You would prioritize the ones that are in a discount and all of these are valid. Okay, all of these are valid. Sometimes can be pretty confusing to kind of like, oh, I have fair value gap, fair value gap, order block, order block, fair value gap. So a simple way to just approach it is when you get an opportunity to, for example, you enter this fair value gap right here, just place it at the stop loss, like at the external range liquidity. Because this assumes that if you're anticipating price to head towards this bullish external range liquidity, then chances are, right, chances are if your trade thesis is correct, it's very unlikely that you would actually come all the way down here, because at that point maybe the market has shifted, maybe the order book order flow has shifted, and you are in fact now shifting to target bearish external range liquidity instead. At that point, um, you have gotten stopped out of your bullish trade, and now you can potentially think about getting into a short. So again, the stop loss is just the point at which your trade idea gets invalidated. If you're anticipating this order block to hold and the stop loss goes below the order block, simple as that. But that's internal and external range liquidity. Again, since defines them purely as fair value gaps. But the way that I would define it is that they are just levels of retracement that you can get in on trades so that you can target, or rather take advantage of the move heading towards external range liquidity. So yeah, now we go into your last couple of questions. No, actually you still have a few more questions. What is a down close candle? It literally just means a candle that closes bearish. That's a down close candle. This candle that closes bullish is a bullish candle. Like literally that's it. This is a down close candle. This is a bullish, like this is an up close candle. Are order blocks a series of connected up or down trending candles? So I'm not gonna answer this specifically because I feel like I've already answered it when I was explaining order blocks to you. What is a broken base? All right, a broken base is not a form of an order block. Essentially, a broken base is simply a liquidity sweep that leads to a formation of an order block. Now let me just remove everything on the chart so that I can explain this to you. So for example, this is a bunch of sell-side liquidity right here. Once the liquidity has been swept and you form a bullish order block, this is known as a broken base. It's essentially an order block with a strong low. A strong low, if you recall, is a low that forms after sweeping out liquidity, right? And the reason why it's strong is because considering that the liquidity here has already been swept, the market no longer has that much of an incentive to continue going lower because people are already stopped out It's more worth their time to go towards the outside to take out buy side liquidity instead. So that's what makes it a strong low because liquidity has already been swept. It means that this low is likely to be protected, which means that if you place your stop loss underneath this low, it's more likely that you're, or rather it's less likely that you're gonna be stopped out. Now, a broken base is, okay, remember a broken base has 2 parts, a strong low or a strong high if you're looking for a bearish broken base, followed by an order block. So for example, at this point right here, this is an order block. Why? Because price ended up closing aggressively through it. Plus you have a strong low. So this is a broken base. A broken base is simply a higher probability, more specific, and more like— I don't want to say better, but it's definitely a higher probability type of order block because you have 2 things going on for you. One is that liquidity has already been swept, so price is unlikely to go beyond the order block, right? And secondly, you have an order block, which means that this is an institutional level of accumulation/distribution, which means that as price returns back into here, very likely you're going to bounce away from it. When you bounce away from it, it's very unlikely that you're going to like just slowly edge down towards the downside because, well, again, you're dealing with a strong low or a protected low. So hopefully this answers your questions. This video honestly took way longer than I initially anticipated, but hopefully this is way more explanation that helps make sense of things for you. Yeah, if you have any other questions, feel free to just holler over.










