Potential Big Move Incoming For Bitcoin, Don't Miss This
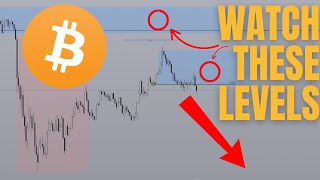
Bitcoin trade plan for June 13 with a news-driven move expected around 10am New York time. Weekly bias is bullish but the daily candle suggests shorting intraday, using liquidity sweeps and order blocks for entries. Take profits conservatively at 2R or trail to the Asia low.
Questions this video answers
June 13, 2025
10:00am New York
100,000 (conditional on a volatile move)
106,800
Take profit at 2R, leave a runner to the Asia low if desired
Chapters
What's good guys? Welcome back to another video. Today we give you guys the setup for bitcoin. News is happening pretty late today. So expect there to be some kind of manipulation move before like the most volatile move of the day. But before we get into that boys, yesterday we played that so perfectly like everything was lining up. And I was basically just saying, yeah, just short all the way until this point here. So potentially today is going to just be a setup all the way until 8:30. You may sweep out the liquidity and then boom, right the opposite way. If you, you see that happen or if you see price just start breaking lower. From this point onwards, that's going to be your go sign that you can start trading this lower in terms of the targets. It's going to be tough but I'm going to stick to my guns. What I usually do is just two R, as simple as that. But if you want to aim a little bit further today you could see 106800 and then to potentially expect a reversal after 10am New York. And check it out, that's when the reversal started to happen. 10:00am Exactly. Boom. So yesterday was just clean accumulation, breakout, continuation and then ultimately reversal during the New York late morning to maybe early afternoon and then boom, the rest of the afternoon you just started going down. And again we're not trying to capture the, you know, the biggest move of the day. That is quite an impossible task. Mainly what we're trying to do is to capture a high probability move from every day. And yeah, that puts us up to 68 out of 82 on all of these YouTube publicly hold trades. So today I'm going to try to do the same and maintain this win streak. Yesterday was a brilliant day. If you managed to make money or if you found this helpful, drop a comment down below. It always. I read every single comment and it truly means a lot whenever I see any positive words, even negative words. It does mean a lot as well. I do take it to heart and try to improve. But anyways, going back into the video, well we're going to kick things off first with the fact that news is happening at 10am today. So it's a bit later than what we've expected so so far this week. Now if you guys recall, the reason why news is so important is that every time when you are thinking about a trade or every time you look at a chart, there are always three things that you need to figure out. Number one is the direction. Is it going to go up or is it going to go Down. Number two is how far is it going to go up or how low is it going to go. And then three is figuring out when the move is going to happen, how quickly it's going to happen, and how long it's going to take for that move to happen. Now, of course, it's impossible to accurately, you know, predict all, all three. And that's why news is such a good friend of ours as traders, because it basically tells us that, hey, at 10:00am New York, we're pretty much going to get a move, right? And it's just going to be our job to determine where that move is going to go. It's going to go up or down. And so today expect the trade to happen sometime closer to like 9:30am during the futures open, because that's when, you know, you get close to news. Today, news is, yes, not the biggest type of red news, but still it is a valid piece of news. And so we're going to look into it. So far on the weekly chart, we're still bullish. And although this weekly candle is probably going to close bearish. And yeah, this further gap has already been filled, so we're not going to look at this anymore. But the daily chart is very telling because so far yesterday's candle closed really bearish, which means today the bias is supposedly bearish as well. Although we have already had quite a bearish move so far, Price seems to be kind of coiling up for a secondary move. I'm going to break that down in a bit, which is understand that if Price or like if the news is volatile later, this is going to be the target that's going to be hit. So that is 100,000. Basically we're going to go back to 100k only if price gives us a volatile move later. But more likely than not, this CISD block here, this is basically a bullish order block. And this is occurring after sweeping out this, this, this and this liquidity, right? With this move right here, you've swept out all of those liquidity, which means that everyone now that needs to be stopped out is stopped out. And ultimately you broke market structure really quickly. So for those of you who do not know, this is known as a broken base. And it is one of the highest probability reversal signals that we have, or in this case, trend continuation. This also means that more likely than not, this order block is going to hold, which means potentially if we do sweep out this level right here, it's just going to be a sweep and it's unlikely that we're going to close below that level. Why? Because on the weekly chart we've already identified that this is a bullish favorite gap. And we predicted last week that Price would come like retrace into it and then start heading higher, which we were right on that move. So because this fe gap has already been filled, it's unlikely that you're going to go all the way back there to like just invalidate it. More likely than not, you're just going to sweep out that low, fill in the February gap a second time, and then give another bounce. Essentially, what you need to understand is that Bitcoin is currently within this range at the moment. I know it doesn't look like a range on the weekly chart, but of course, the moment you go into the lower time frames, you realize that it's around range. And the only thing that you need to keep in mind when it comes to ranges is that the opportunities exist within or rather below the range low and above the range high. Basically, if you go below the range low, you can take a long, just like what we did here. And if you go above the range high, you can potentially take a short. Of course, this takes into consideration the overall market flow and the overall market trend as well, because so far this is looking pretty bullish. So going back into what we were talking about before, it is, let's just say not as likely that Price is going to come to this level. But if it does, look for it to be some kind of manipulation move and you're going to get a V shaped recovery. That's the main takeaway that I want you to take away from this. Now, of course, I can be totally wrong. And if Price just poses beneath this ver gap, then guess what? Next week we're just going to trade it short. But until that happens, we're still going to lean towards bullishness on a higher time frame. But in a lower time frame, that can be a different story. So let me break down what that means. So we've already established the fact that yesterday's candle is bearish. So today we also bearish. But the problem is that you already have a bearish move happening, which means right now there is an opportunity to catch a reversal. Although that highly depends on what Price is telling us. Because so far, Price is currently within this bearish family gap here, and you have another family gap above here. Like, basically, until you break above this bearish order block right here, you're not fully, fully bullish. At least today is not enough to tell you that it's Bullish. Why? Because yesterday's candle is bearish and so today you are pointing bearish until proven otherwise. Now that we understand this, it's time to go into the lower time frames. Because now the lower time frames is also telling us a very interesting story because so far this right here is a bearish order block, at least from the 15 minute chart. Now ideally we do not look for these PD arrays from the 15 minute chart. Ideally we find them on the one hourly, but on the one hourly it is not present. So our only choice is to look for it on a slightly lower time frame. And we can also mark out this order block here as well. This would coincide or this would line up with this one hourly favorite gap. So far we have the Asian range, which was a pretty volatile session. And so far London has not done anything. In fact, the entirety of the London open kill zone has already passed and nothing has happened. The main reason here is because today we have news happening later than usual. It's at 10am, which is an hour and a half later than for example yesterday. And even yesterday London did not really do much until you got closer to 8:30am and then boom, that's when the target got hit. Although we were right on the London move yesterday. And yeah, once the news happened, that's when you see the volatility kind of kick in. And so expect something similar for today where London has not yet taken out Asia's high or Asia's low. Which means the opportunity for today is going to be that prior. Like right now, as of the time that I'm filming this, it is almost 6am New York. Sometime between 9, 9:30am Maybe 10am New York. If price is at this level right here, once the news drops or like once anywhere between 9:30 to 10 or maybe 10:30, if you start seeing price like just start breaking lower, it means that this ends up just being manipulation. Basically you sweep the Asia high during the New York morning. You also sweep out the London, of course, sweep out London and Asia high and then boom, reversal, distribution the other way. That's going to be, in my opinion, the more likely scenario. And most importantly, this will be the trade that I'm looking for. Primarily because one of the core tenets of my system, in fact this is unbreakable. Like I do not ever break this unless it's just like a really obvious setup. But for the most part I need time frame alignment. Basically, if the daily chart is pointing down and if the hourly chart is pointing down, if the 5 minute chart is pointing down, Only then do I take a short. In this case, the lower time frames as well as the higher time frames are pointing towards the downside. But if you take a look, like, just to give you an idea, that's what I mean. Like you can argue that this right here is bullish order flow, but you need to understand that if you take a look at the overall trend here, it's like bearish. Look at how big the bearish moves are compared to the bullish moves. Big bearish move. And then even though, for example, this move here was worth 5 percentage points and it took 7 hours and so far from that point onwards prices pumped only 2.75% in the same seven hour period, maybe eight. Like if you consider this candle, clearly this is a retracement move. In fact, this candle's about to close, so it's about to become nine hours. So clearly this is a retracement before continuation. I could be wrong, but this is just how you differentiate between moments of like if you read the impulses, of course, big, impulsive move, retrace, big, impulsive move, retrace. Big, impulsive move. That is how the logic goes. So the next time you find yourself in a situation where you're not too sure of the trend, this is how you kind of read it. This is also the same method that we were able to use to prevent ourselves from thinking that, oh yeah, one hourly is showing bullish order flow and so we should be bullish on the day. No, it's so far bearish. Right? The, this is clearly just a retracement move. Similarly, this is also just a retracement move. Ultimately the trend is still pointing down and we continue to trade what the market is telling us until proven otherwise. And that's another key lesson here. It's like we may have an idea of what we want to see in the market. Like, obviously I hold bags of crypto, I am a crypto investor. Clearly I do not want to see bitcoin go lower because that also means that altcoins are going to go lower. And yet the reality is that it doesn't matter what I think. It matters what the market is showing me. And ultimately my job as a trader is to read objectively what the market's trying to tell me. Ideally applied into a system that has edge and then trade that system. Trade what the market's telling you, not what you want to see. So far this looks like a retracement move. And the area of retracement could be either into this block or to this block, you'll sweep out the Asia high, you'll sweep out the London's high and boom. That will give you a clear just trigger to go towards the downside. Now one last thing that I do want you guys to keep in mind, this is a very likely scenario as well is the fact that because Asia has been so volatile and yesterday's candle has also been volatile, the markets tends to move from periods of high volatility to low volatility and vice versa. From low you go to high volatility and then you know, that's kind of how the markets work. That's also why when you have big impulses, market just goes into a period of chop, right? That's a very common, in fact that is quite literally how the markets like to move. And the reason for this is that you know, when you go into these choppy periods there are a lot of rookie traders and people that don't know what they're doing. They're going to be, you know, they're going to get impatient. I'm going to get into the market early before you know it has given them the right setups. That's also why you watch this channel by the way. I'm able to accurately give you guys the setups even within choppy conditions such as this one. That was a clean two hour trade yesterday, had a clean trade even on the day before, even on Monday. I managed to give you guys a clean move. But overall like just understand that because you have had such, you know, this much volatility, you may not get that much volatility heading into the New York session. Which also means that to be safe you want to set your target underneath just the Asia high for today or potentially even just at 2R right? Which is taking into account the potential volatility that could be present today. Just to give you an example, if you take this trade like recommendation would be just take your profit at 2r. If you want to leave a runner, leave it for the Asia low. And if you, if the market's really just popping then yeah, you know, target 100k. But otherwise like just expect that because the rest of the sessions today, specifically the Asia session has been this volatile. You may not get such a huge movement and so definitely take some profit at 2r if possible. But overall that's going to be like the first setup that I'm looking at basically sweeping above the Asia highs and London highs before going downwards. The second scenario which is also possible is that price could also just start breaking lower at this very moment. And if so, the thing you want to look for is for Price to get a one hourly close underneath this bullish order block right here. Retrace, you're going to turn this into a breaker block, basically flipping potential support into resistance and then going lower. Remember, one hourly close underneath this to validate this setup. Now if you see something different on the five minute, for example, right now you're already getting changes data delivery, which means that even right now this is already technically a valid setup, but this is going to be a subpar setup because the Asia high hasn't been swept yet. And this is a what we like to call a weak high. Basically this is a high that forms before sweeping any liquidity. You could argue this, but like liquidity really means like some kind of higher time frame point of interest or like just area of interest. And so far that has not yet been hit. And so I'm going to play a bit cautiously, wait for closer to the news event which is at 10am and seeing how price action plays out before going in. But if price action is just continuously forming bearish order flow, which means you already have the CISD here. And so now on the five minute chart, this now becomes the bearish order block. And then if Price does break out, break down from here, then this is going to become the new bearish order block. Price just holds and holds and holds and you keep spawning bearish order flow. Then yeah, feel free to just momentum trade this all the way down to the Asia low. So hopefully this gives you a pretty good idea of what to expect heading into the day. And again to all of you guys who dropping comments, I appreciate you. I read every single comment. And if you've watched until this point so far and you appreciate these analyses done from the smart money perspective on crypto, then make sure you subscribe because like we're right about 80% of the time. And I'm coming to you guys daily or at least every weekday with these types of videos. And lastly, if you would like to work with me one on one to get funded within the next 60 days, then feel free to check out the first link in the description box below. We are already full. Like we're sold out like one intake in advance. But if you're interested in potentially working with me, then sign up to the newsletter and we're going to announce when the next intake or like the wait list for the next intake is opening up. But for now, see you guys in the next one. Have a great weekend and have a good trading day today. Cheers.










