Solana: Big Move Incoming, Position Yourself Accordingly
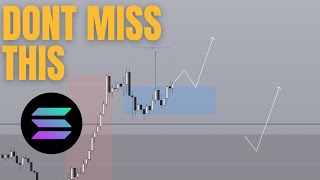
Technical analysis of Solana across multiple timeframes. Weekly close is bullish but a bearish order block persists until $178 reclaims; key support sits around $150-$165. Intraday traders watch for a close above $167.50 to trigger a retrace setup targeting 2R profit.
Chapters
What's up, guys? Welcome to the first altcoin analysis video in a long time. In this video, we're going to talk about Solana only because the setup on Solana is getting pretty clear, and ideally I would not want you guys to miss it. And so I'm going to get into the setup for today as well as. If you're a swing trader, I'm going to get into that as well. Now, for those of you who are new on this channel and you do not know me, I have been publicly tracking all of the analyses that I've made on YouTube. Mainly they're on Bitcoin. But so far, since February, I've done 97 videos, and 82 of them have ended up, you know, being a correct call. So I would like to think that I know a little bit about what I'm doing, but otherwise, let's get into the video. So on the weekly chart in Solana, last week we closed bullish. That's a really good sign. It means that this week we are looking for a bullish power of three. Now, you do not need to retrace that low. I'm just showing you that if this is the weekly open, if you dip anywhere below the weekly open, that gives you an opportunity to get into the charts and then before the weekly close. Anyways, the point being, you're looking for a bullish movement, at least from the weekly chart. Now, to the swing traders out there, just understand that this low right here is a strong low because this bukadu point was swept here and then price immediately started, you know, bouncing away from this point. This makes it less likely that this low is going to get tapped. And so if you are taking any entries, feel free to use, you know, this weekly order block over here that I've already drawn out. But if you are in a trade already, then this becomes your new kind of like, invalidation point in a sense, that if Solana were to break underneath this low, it's very likely that it's going to retrace form a lower high and then continue that downtrend. And yes, that you heard it right. I said continue the downtrend. Because at the moment, in terms of the weekly chart, it is not the most bullish in the sense that you have a weekly CISD price breakdown. And at the moment, you are still within this bearish order block over here, which means that until this one gets closed above, you cannot say for certain that on the weekly chart, you are fully, fully bullish. Although for most of you watching this video, you're probably not going to be trading with ideas from the weekly chart, which is why I'm using this just to kind of map out the environment that we're in overall. We're going to be trading on the daily, potentially even the hourly chart and below. And I'm going to break down those ideas for you right now. But just so you know, even if you were to retrace all the way back down to $153, you are still going to be safe because this is a weekly order block, which means that this can be an area of potential support before price continues going higher to $188 and of course higher to $265. Now my long term predictions for Solana is definitely going to be between $400 and $500. That would put it at around a $250 billion market cap, which Ethereum at the moment is already more than $350 billion. So it would make sense, right, for what Solana is capable of or for how good the Solana ecosystem has been. And of course, for all of the memes and NFT trading that is done on the Solana chain, it wouldn't be a stretch to say that solana could eventually 2x3x from this point. Now, even if you don't agree with that, that's okay. Ultimately, I am primarily a trader, which is why we're going to start getting into the trade ideas right now. So in terms of the trade ideas, currently we have two zones that we are interested in following the weekly bias. First of all, this block right here is already marked out as the weekly order block, which means that if Price were to come into this area, this will be again where we look for potential support. This is further reinforced by the fact that you have a another daily bullish order block right here, starting at $155 down to, you know, let's say $150. So in the event that Solana does return to this area, this is just an added confluence that this is going to be super strong support. This does not mean though that Solana will retrace all the way that low because at the moment price is already breaking towards the upside, which means that this right now could just become your new bullish order block. At least from the daily chart. This comes after filling in this favorite gap right here and price starts showing a bullish movement. Another thing to notice is that at least if we get a bullish close today, and it's going to be super just instrumental because this is Kind of like the daily level that we want to look at for a daily bullish change in state of delivery. Now, if you recall, I did mention that on at least on the weekly chart, until you break above $178, which is this bearish order block right here, and you get a weekly close above here, you do not yet have a weekly change in state of delivery. This does not mean that we cannot do anything on the lower time frames. Again, I'm a trader and I tend to be trading on the lower time frames in the daily chart. This is instrumental because at least this confirms on a relatively high time frame that Solana is now shifted into bullish order flow. Again, nothing's confirmed yet. There are still 15 hours left until this daily candle closes. But just understand that this is going to be the level to look for once this happens. Like, every trade from that point onwards is just going to be long, long, long and long. So going down to the 1 hourly chart, what you will come to real also is the fact that this daily order block right here that we drew out also aligns with a lower time frame order block in the sense that if you were to map out the amount of volume that is concentrated, you could see that this area between $164 to $162 looks like really strong support. And so in the event that you're retracing to this, this is just how we're refining down the higher time frame, like really wide levels, using lower time frames to kind of refine them down. And then, yeah, you can take a trade from this point onwards. This would be kind of like the setup that we can expect to hit within the next couple of days. And so if you're a lower time frame trader, this is going to be a very relevant setup for the one where, you know, price retraces down to the $150 level, very likely going to take much longer than a couple of days. And so if you're a low time frame trader, this level is going to be the area where you want to prioritize. This does not mean, however, that once you get into this level, you are just going to place along and set a limit, whatever, and just forget about it. The whole point of going down into the lower time frames is to be able to refine our stop loss and to get a more refined entry in the sense that we do not have to place such a wide stop to get the similar amount of reward. Just to give you an idea, if you were to just set a limit here, place a stop Underneath here you are going to need at least at the very minimum a 6 to 7% move to get a 2R risk to reward ratio. But if you were able to refine it down, let's say even just halfway, you can see that with the same amount of movement you are making twice or even triple the amount of money, that's what the lower time frames serve. Just for today, the one hour chart, it seems like price is about to break out of, you know, above $167.50, which also validates this as a potential bullish order block. Right? So there are 43 minutes left until this hourly candle closes. If this closes, then you could potentially start looking for this bullish order block right here to act as potential support for price to go higher. And so immediately we can already refine the trade down to like in order to achieve a 2R now you only need a 2% move, which is very reasonable when we're dealing with an intraday kind of setup. Is this video going to be about intraday? We're about to find out. So this is scenario number one, where if you're an intraday trader, this is where you're going to want to look for. Secondly, if you are a slightly longer, you know, like a short term trader, then you're going to want to look for this area right here. And of course, if you are more of a swing trader, this may or may not happen. But if it does, then this is going to be the swing traders entry. Now taking a look at these session profiles, you can see that it's still a little bit ambiguous in the sense that this red box here is known as the Asia session. And usually there are two ways, or rather the two high probability ways that the market kind of plays out with the session profiles is an Asia accumulation, London breakout and a New York continuation. That is scenario number one. Scenario number two is an Asia accumulation, London manipulation and a New York distribution the other way. Right. Basically you trap everyone into thinking that Solana is going up, in fact it is going down. And then you distribute to the other side during the New York session. Right now we're at the end of the London session and there is no clear indication that price is showing a breakout. However, there is one thing that is, you know, good or like just positive news, which is the fact that if you draw a fib from the low to the high of Asia, you can see that most of London has like, most of the trading volume in London has been above the Asia like, like in the upper half of the Asia range. Basically right, you've been trading above the mid range. The fact that you did not retrace and break below is a really good sign that potentially today you can look for some kind of bullish continuation. Hence why I gave you in one of the setups, which is if you get a hourly close above this level here at $167.50, you can look for a retracement into the zone and target A2R. Now of course the second potential level is just for this to happen and then you're going to look for a lower time frame change in state of delivery. Now what is that exactly? I want you to take a look at this swing right here. This is clearly a bearish order block. Price breaks below, comes back up, fails to break above right, which means that this order block right here was respected. And because this order block is respected, price forms a new low. And so you can also say that within this range right here, right within this swing right here, you are in bearish order flow, which means you should be looking for shorts. Now a change in state of delivery means that you get a change in order flow, which means at this point right here, you can see that, you know, this is if this was the previous order block that needed to be respected, it got completely disrespected. Once this happens, it shows a willingness in market participants that there are interested buyers in driving price higher. And so that is the changes that are delivery and that is what you want to look for. So once this happens, obviously the order flow in this case is going to be bullish. And so you just continue the bullish order flow. Now if you reach down here, you will run into bearish order flow, at least on the lower time frames. But if you start getting a change in state of delivery once you tap into the higher typing key level, those are going to be some of your best trades. And by the way, if you would like to work with me one on one to get you from where you are right now to full time trading within the next 60 to 90 days, I have one spot left in the current Contega bootcamp. Feel free to click the first link in the description box below to find out what that is. But otherwise like and subscribe if you would like to see more updates done on altcoins from the smart money perspective and I'll catch you guys in the next one. Bye bye.










