0:35
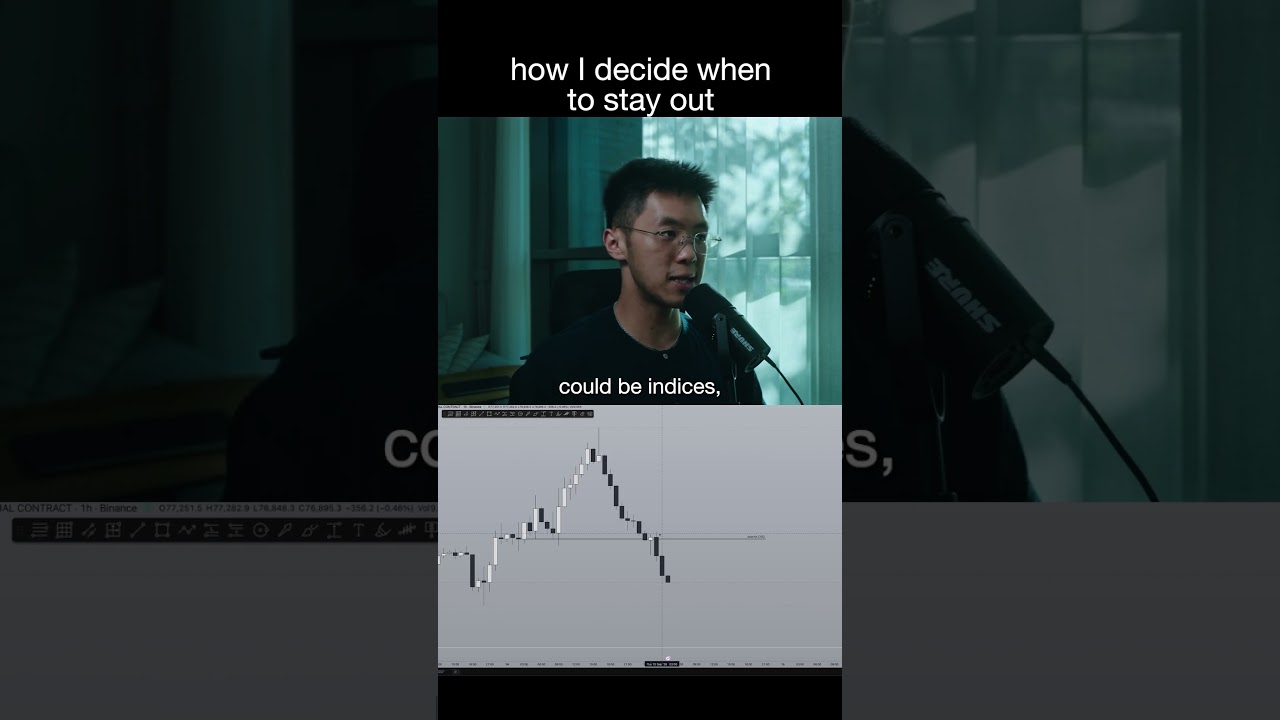
When daily charts say buy but shorter timeframes say sell, that's a red flag. The Art Of Crypto recommends sitting out Bitcoin until the signals align, and trading forex or indices instead when timeframes conflict.
When daily charts say buy but shorter timeframes say sell, that's a red flag. The Art Of Crypto recommends sitting out Bitcoin until the signals align, and trading forex or indices instead when timeframes conflict.
If I were to be completely honest with you, this is usually the type of day that I tend to avoid for the same reason as why I don't usually trade on Mondays. And whenever I see this, I just decide like, okay, my time is probably better spent elsewhere. Could be forex, could be indices, but it doesn't need to be Bitcoin specifically. And that exact signal is timeframe misalignment. When we look at the daily chart, we know we're supposed to be looking for longs. The moment we come down into the lower timeframes, the signals are printing that, hey, we should be looking for shorts. Right now, there's a bit of misalignment where one timeframe is pointing up, one timeframe is pointing down. Whenever you see that, there's usually a reason why the market is printing this kind of signal, right? Ideally, you want to stay out of this.










