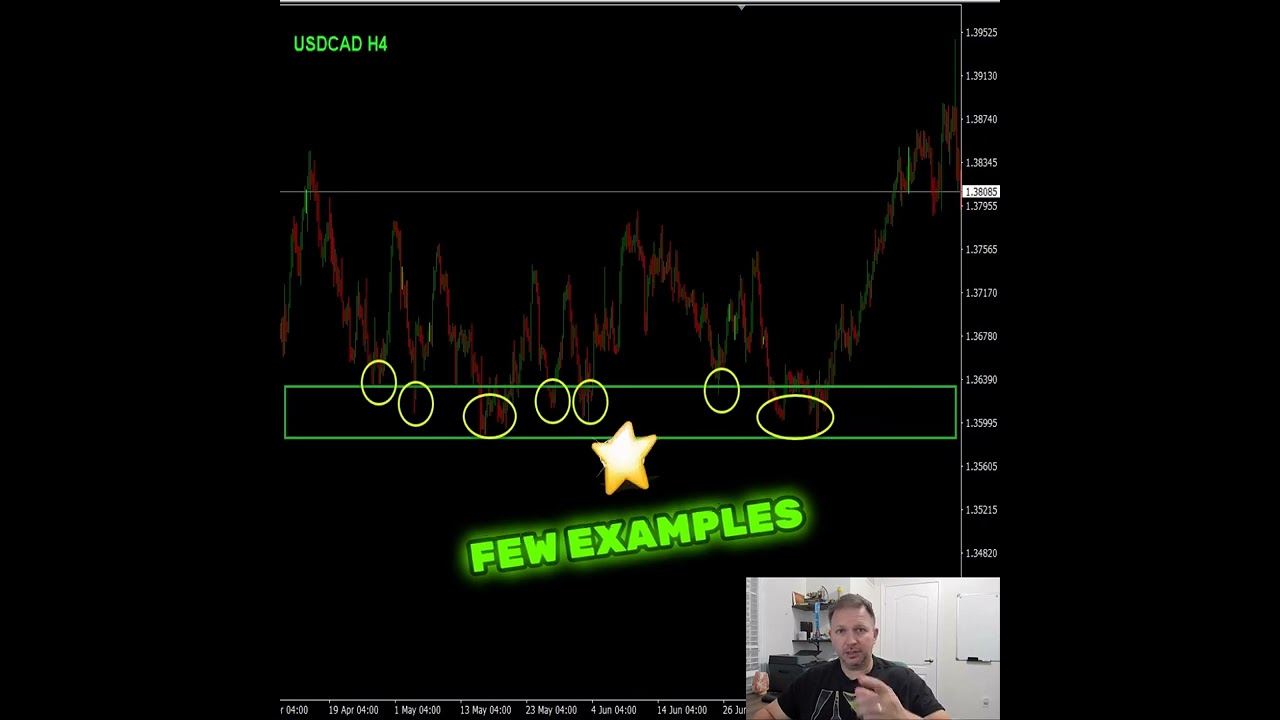
Vladimir Ribakov explains support zones in forex trading: price regions where the market bounces upward repeatedly rather than breaking through. A stronger support zone gets tested more times. He shows a USD/CAD chart where support held over five times and a NZD/CHF chart where it held three times, each bounce leading to a rally.
Chapters
Here is what you need to know about the support zone. Here is how support zone looks like. Support zone is a zone which the price could not break through, was holding for several times, and the price bounced off this zone. The more touching points or spots You can find on a zone, the stronger this zone considered to be. Keep in mind that support is not a level, but a zone. There is a high buying interest around support zones. This could be useful identifying entry points and trend reversal or to join ongoing trend on higher time frames. You can watch for bounce-off signs or breakthrough signs as your trading opportunities. Here are a few examples: USD/CAD 4-hour chart, strong support zone which holds more than 5 times here, as you can see, and every time the price is there, the price bounces off to continue and rally upside. Here is NZD/CHF 1-hour chart. Strong support area holding for 3 times. Every time the price touches this zone and bounces off, buyers take control and rally continues. For real-time trading education, real-time trading opportunities, full trading courses Join our trading family, the Home Trader Club.