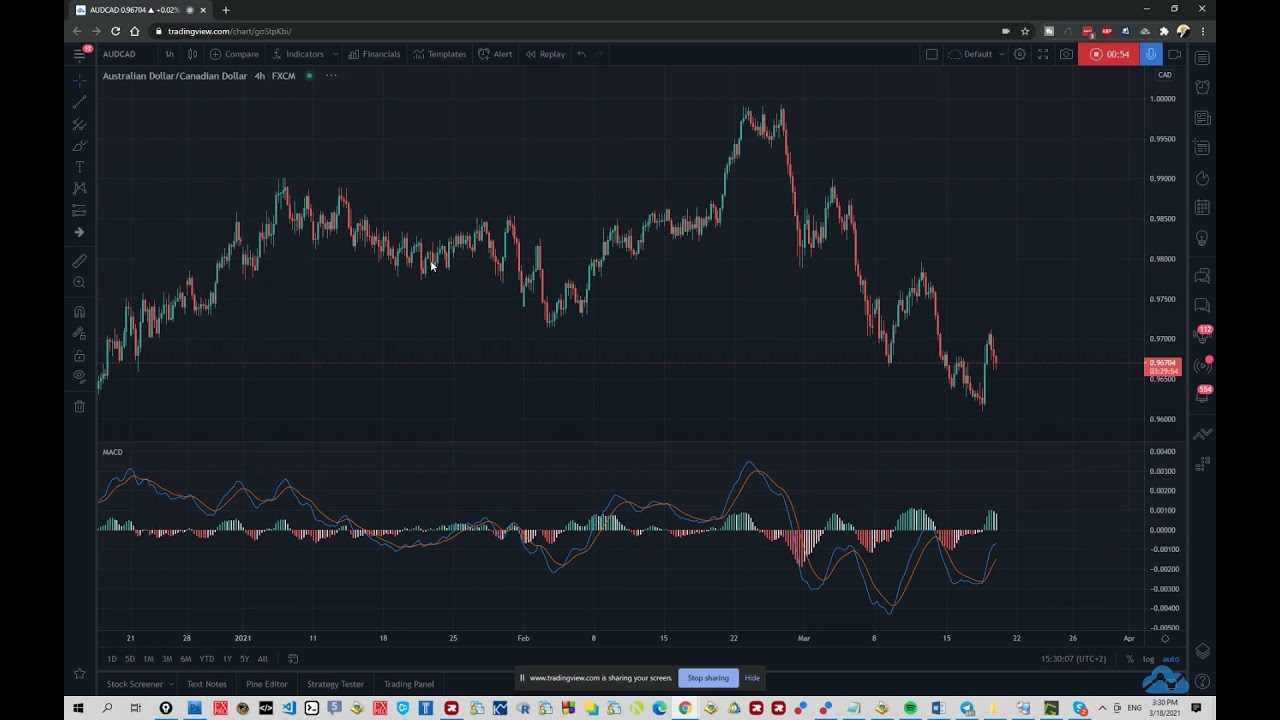
Jordan analyzes AUD/CAD across multiple timeframes, identifying a daily sell bias but spotting an intraday bullish setup on the 1-hour and 15-minute charts. He marks a key support level and suggests entry points for short-term longs as long as price holds above that low.
Chapters
Hello everyone and welcome to another technical setup from the Traders Academy Club. My name is Jordan and today I'm going to share with you a potential setup in AUD/CAD. Now I'd like to start with the higher time frames just to give you an idea where do we stand on the higher time frames and what's the idea on the lower time frames. So starting from the daily chart We can see that there was a convergence here and the price started pushing into an impulsive structure, which technically speaking means we need to see pullbacks. And later on, probably we're going to see continuation lower. That means in the mid-long term, the expectation here is pullbacks and sells. On the lower time frame, however, If we drop to the 1-hour chart and the 15-minute charts, we can see here that the price inside the 5th wave completed the structure on its own and started building these divergences, which later on were followed by a breakout of this zone. So the idea here is very simple. Since we are expecting the price to push higher and then probably give us a setup for the sell side, we can try to enjoy from this push to the upside. And this is where the intraday time frames kick in. This is where I have identified this bullish structure. Again, we got the breakouts, which in other words means as long as We're holding this low. The price is holding above it. The levels starting from the current zone and going slightly lower become good levels for potential buy opportunities in the short term. So that would be all for this idea, guys. If you have any questions, please leave a comment below and I'll be happy to reply. Thank you.