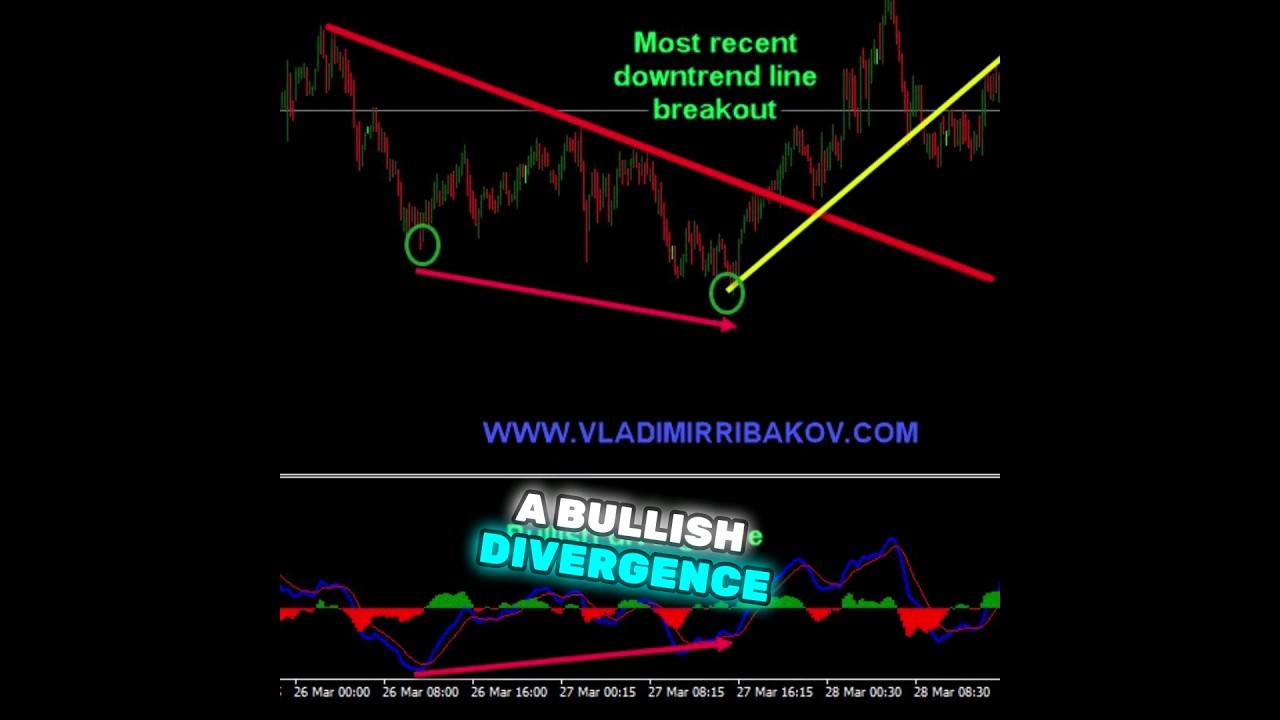
Vladimir Ribakov breaks down a bullish AUD/NZD trade on the 4-hour chart. He spots a higher-highs/higher-lows trend, MACD bullish divergence, and enters on a breakout above falling resistance. The pair then rallies to new highs.
Chapters
Here is my Aussie Kiwi buy trade explained. This buy trade was shared with our members in my blog vladimiribakov.com. Bullish trend pattern is clean on the 4-hour chart, sequence of higher highs, higher lows. Heiken Ashi candles are bullish and supporting buy. ADX indicator is bullish as well, supporting the bullish plan. As long as this key supportive area holds, my plan: buy the pullbacks. And here comes the pullback in format of 2 waves down, ended up as a bullish divergence on the MACD while the market was making lower lows. MACD higher lows, classical bullish divergence. The break above the falling resistance line is my buy. And as you can see, the AUD/KI does not disappoint and continues the beautiful rally to create new highs. Join Home Trader Club for complete trading courses, real-time trading education, and real-time trading opportunities.