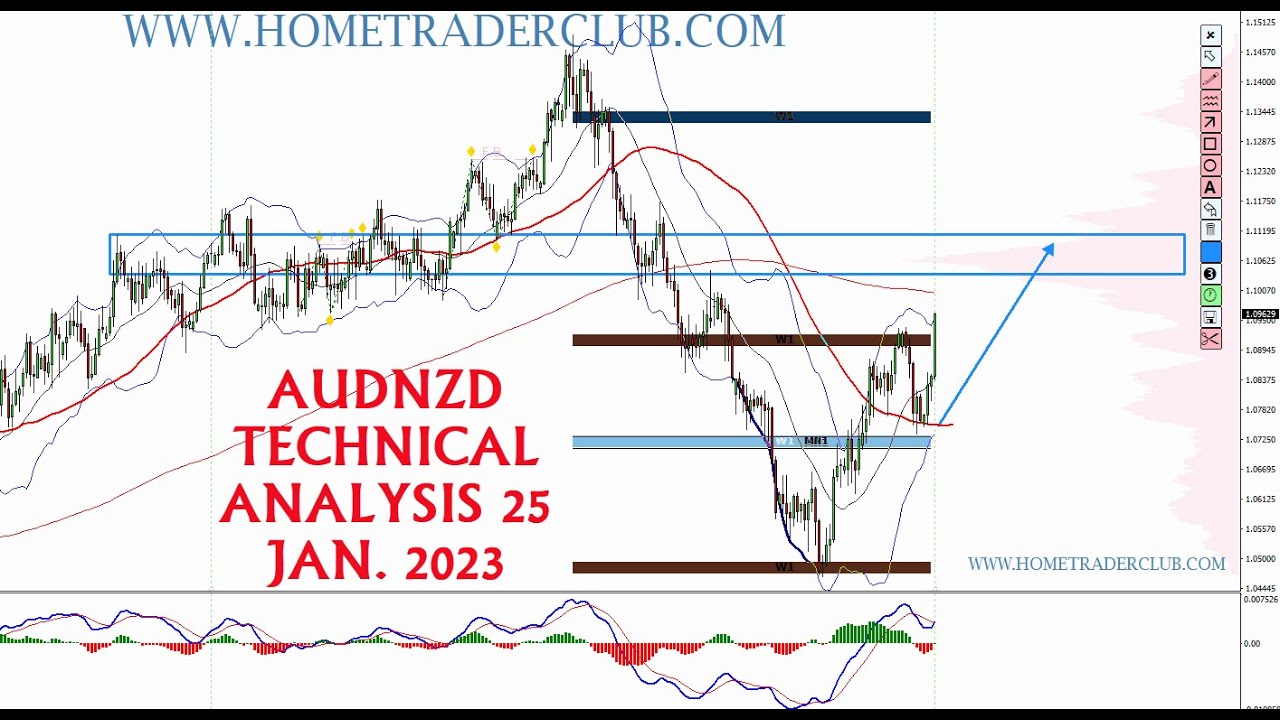
In this video Vladimir Ribakov provides a follow‑up technical analysis of the AUD/NZD (Aussie‑Kiwi) currency pair after a weekly forecast. He confirms that a bullish hidden divergence materialised on the weekly chart, with higher lows on price versus lower lows on the histogram. On the 4‑hour chart a double‑bottom pattern formed, accompanied by a bullish divergence on moving averages and a histogram flip from negative to positive. Ribakov highlights key supply and demand zones that align with a broken support‑turned‑resistance near the 50% Fibonacci retracement, and points to the 61.8% retracement as the next critical level. A large daily volume‑profile zone coincides with these levels, reinforcing the price action. He also plots a Fibonacci expansion, noting that the 61.8% expansion level matches the identified zones, suggesting continued bullish momentum. Finally, he explains that the MACD is expected to develop lower highs, signalling a potential bearish divergence and an exit point for his long position. The video ends with a call‑to‑action to join the Home Trader Club for further education and community support.
Chapters
Hey guys, how are you? Vladimir here from Home Trader Club, and this video is my follow-up and technical analysis on the Aussie Kiwi. But before I go to the charts and start talking all the technical conditions we have on this one, if you are new to this channel, welcome to our fantastic community. Please Hit the like button below this video, subscribe to the channel, and feel free to share this video with anyone who you believe can benefit watching this one. So this pair we analyzed on the weekly forecast. If you missed this video, make sure you watch it for the full analysis. The conditions I explained in this video were that we are very likely to build a bullish hidden divergence. Where the market will create higher lows on the chart versus lower lows on the histogram. This condition exactly happened this week. Of course, with the news from New Zealand and Australia, this boosted the move, but the technical conditions and the fundamental in that case lined up synchronized and causing the bullish direction as expected. So the question is, what is next? So Let's go to the 4-hour chart just to show the waves. So the daily did complete the hidden divergence, and the 4-hour chart caused here a sort of a double bottom with a bullish divergence on the moving averages. The histogram flipping from negative to positive to negative, creating this place to hold, a beautiful area around the support zone. This was a resistance Right, and after the breakout, it was holding for several attempts. Okay, and all that happens, all this hold on this key volume profile-based area. So after the double bottom, the price managed to break the high, completes the structure of higher highs, higher lows, classical price action structure, and gains the momentum. The biggest question remains here: What is next? So for all those of you who are involved, there are several levels I would be paying attention to. So starting with the Fibonacci from all the very top to the very bottom of the bearish move, there are couple of important levels on the way. The first one is of course the 50%. Next one is 61.8, and this has my eye on it. Uh, for a few reasons. Okay, so first of all, let's plot this Fibonacci and you would see why I have my eyes on this one. Let's talk about the supply and demand areas at the moment. So the— I'll put it in different color as purple. Okay, supply area, supply area, previous highs of this downtrend. Now look how well They fit in the technical conditions. It was a broken support that becomes a resistance, right? Right next to the 50%. On the uptrend, the last high that not yet was tested is this high. The high afterwards, right here. The high afterwards, right here. And this is exactly why the 50% is the first key level. And the 61.8 is the next one. It corresponds to Fibonacci retracement. It corresponds to the previous swing highs that behaves as broken support and resistance as supply areas. And look at this massive, massive, massive, massive daily volume area. Okay, this is a volume profile, massive zone, which I believe will synchronize together with the price. Besides that, if we plot Fibonacci expansion on the ongoing move, here is the interesting thing that you will find out. The 61.8 fits exactly on the zones we just explained. So this is why I believe the Aussie-Kiwi momentum is yet bullish and it should continue until it finalize this rally completes some bearish divergence. While the market will make the higher highs to the key levels, the MACD will start to create lower highs on both the moving averages and the histogram. So that would be the signs where I will cash out my buy. So this is a quick follow-up to all those of you who followed the idea from the weekly forecast video. So that's it for this one. For any questions, don't hesitate to ask in the comment section below this video. And I invite you to join our trading family, the Home Trader Club, and get your access to the best offer we have for you, as you can see on this very image, including all our trading courses, real-time trading education, real time, trading opportunities, amazing community, and many, many more amazing things. Join our family with the link below this video in the description, and I hope to see you with us. All the very best to you and yours. Thanks for the time watching this video. I'll see you soon with more. Bye for now.