Best cTrader Indicator for Better Entries? TMAX RBA Review
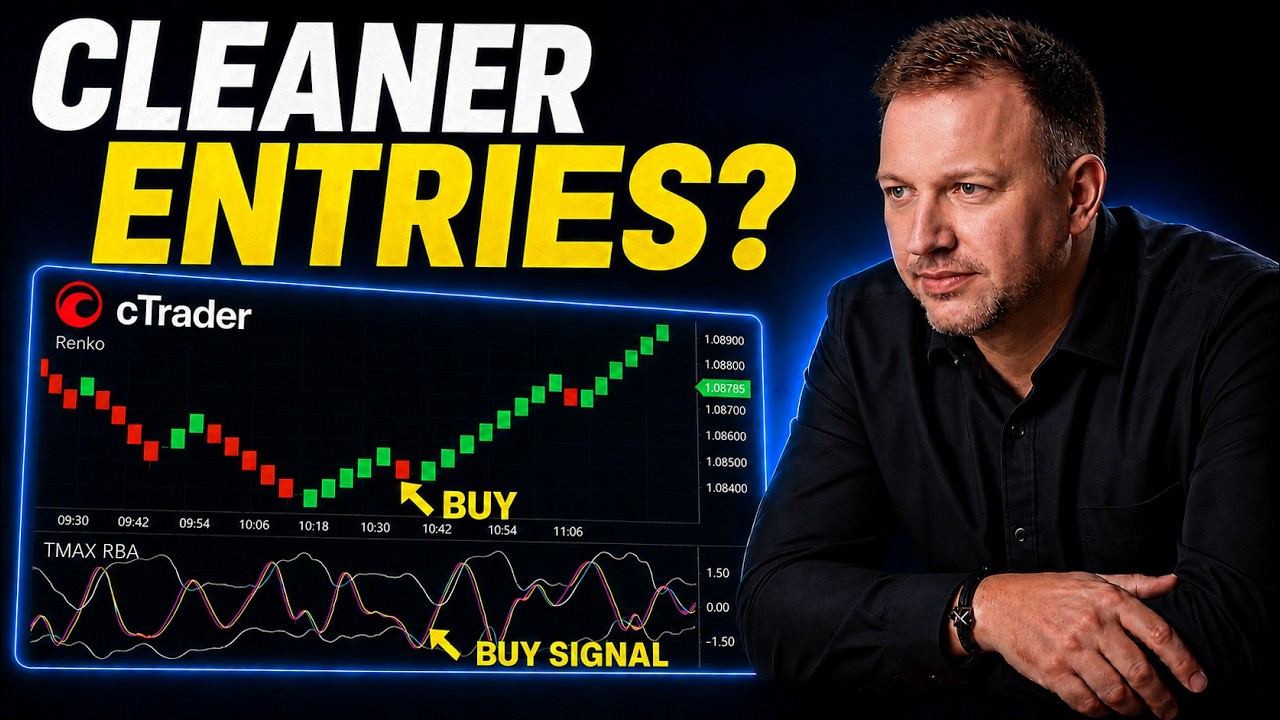
Vladimir Ribakov reviews the TMAX RBA Ultra indicator for cTrader, which combines Bollinger Bands and multi-timeframe moving averages to time entries. The method works best on Renko charts and pairs high-probability setups with MACD divergence, but requires proper risk management and avoiding volatile markets.
Chapters
Bollinger Bands, multi-timeframe scan of moving averages. Sounds like way too much? Not necessarily, and I will say even the opposite. When used properly, could be the game changer in some cases for accurate entry or not, verified entry or not. And in this video, I will be presenting one of the indicators from cTrader store that does that exactly. Bollinger Band with multi-timeframe moving average scan, and when it shows the combination of the crosses, could be a game changer. So let's begin. So first of all, welcome to the channel if you watch that for the first time. And if you don't know who I am, make sure you watch this video and to know, to learn more about my story. I'm internationally certified financial technician, which means I understand a thing or two when it comes to technical analysis and trading. I've been around for 2 decades, and in this video I want to give you my 2 cents maybe even more, 5 cents in that case, how to use this fantastic indicator. I personally was introduced to this one just recently, and in a proper combination with things could be very helpful indicator to you as well. So this video will be presented on cTrader platform. I could speak about cTrader for hours and hours. Here are all the reasons why cTrader is superior platform and why Steadily it climbs to the very top of this industry. CTrader offers you amazing features. One of them, it's also built-in indicators without any proper complications, without any serious, uh, complex things or anything like that. Uh, click install and you got it here. So this indicator, I'll show you directly from the store. This is the indicator called TMAX RBA Ultra, whatever the bombastic name it is. And it's very important for me to mention that's not any sort of recommendation or anything like that. It's a pure review to great tools that I come across, and I like to put it here on the playlist. And if you are new to this channel, there is a dedicated playlist to cTrader videos which you can watch on my channel, or I put it here for you in the right top corner. There are videos that explain how to work with the cTrader platform, all the features, as well as different indicators and trading strategies combination. So this video falls in this category exactly, which means I will be reviewing this indicator, and not just for the features or anything like that, but to give you my 5 cents As I said before, a bit more than two, and you would see soon why how this indicator could actually help you. Okay, so you know my view, or if you don't, if you are new to this channel, my view is indicators indicate price dictates, and when you get the combination between them, that's where you can get the edge. So you can climb through the features of the indicators and everything. These are the things I personally find always things I don't believe to personally. I don't love these kind of claims, but here comes the but. Every indicator indicator itself would never make you money. Okay, let's start with that indicator by its own would never make you money consistently. Could be great periods, but for the long run, it's doomed to fail. Every single indicator. The question is the usage, where and how it is done, and that's exactly where I would want to show you. So even though this, the author here claims that this is for 1 minute, you can see scroll down and see that's 1 minute and gold, Bitcoin, etc., etc. What I personally find useful here is the combination of you can do it regular price section, of course, the regular bars, but I like to do it with Renko charts. Okay, so you can see even if you go to the 1 minutes, you have the waves. Okay. What I like to do is to go to the Renko chart. So let me show you how to do it. I go to the here these three dots, Renko. I personally love the five pip, ten pip. Depends on the instrument and depends on the momentum and and the ranges that you like to trade. So for gold, five points is actually a quick change, and that's why I personally like that. So this indicator once again, it's called the TMAX RBA, and it could be. Found in CTrader store under the indicator section. So after the installation, this is how it looks like. Now I have also MACD here, not necessarily, just for me, and you would see why. Uh, sometimes I find it kind of helpful. So what I like here, okay, so the idea of the indicator by itself, the price— that's what the indicator, uh, says— the price is above the Bollinger Bands, right? The moving average above the Bollinger Band. Then cross it to the downside, that should be the sell. And similar with the buys here and here, it's under this, this, this white indicator, that's the Bollinger Band. So above that, overbought, under that, oversold. And that's why when it curves up, you would be looking for the buys. Many times you would find these, um, kind of lazy moves, fake moves, like here and here. See, that are doomed to fail. So in this video, I will show you exactly how I like to do that and increase probabilities. So before I continue, what I want to give you here is a little edge of what will come next. I love to trade from clearance zones, and I will explain what clearance is from my point of view. When you are in a bearish trend and you have sequence of lower highs, lower lows, The previous highs are zone of supplies. When the market comes close to there and then fake out the breakout above that and retraces down again, many times it leads a great sell opportunity. It could be this high or the high before. After clearance, it many times continues with the trend. And when you are in an uptrend, you would be looking for a sequence of higher highs, higher lows. and then the lows of this uptrend will be the zone of interest. So when it comes to clean this level and bounces many times, it is a sign for continuation. And this method is exactly what I like to implement in the direction of the trend and to come with combination of this indicator. So here is an example. You can see that we clearly have here a sequence of lower highs Lower lows. What is the zone of interest? Last high here and the last high here. Ideally, it will it will clean it, which means try to go above and then would close below that. And that's where Renko chart is basically what Renko does. It eliminates the length of the period. All it does is calculates by In that case, five pips because I choose rank of five pips. Every five pip when the market makes direction up or down, it gives me a candle equal five pips all the time. That's why it is so visual and so helpful. Unlike the other, the regular bars which are much more volatile and could be zigzagging for a while. Zigzag here, if it just doesn't do the five pips, it will just not create. The bar. As simple as that. So when it comes to clean this area, ideally I want to see the price going above, but because we are talking about Renko here and not just spikes, even a touch at that area and a bounce is good enough. When that happens, I am looking on the cross of the moving average of this indicator, uh, and while they are above the Bollinger Band, which is the white line, that gives the edge because once you Once that happens, you got a great opportunity because with the protection above the last high or low, in that case a high, you got the edge. And many times it provides a fantastic risk-reward ratio as long as the trend continues. Okay, so what happens next? Take a look. We got a low, high, low, High, low, high. And the similar story happens. It comes to retest this high, attempts to break again, right? The high of this move. There is this high, there is this high. I don't know where the market will bounce off, if at all, but I mark these highs. And once this clearance happens, I am looking at the indicator and it gives Another cross to the downside, which means to me that we have right here that we have a beautiful opportunity. And as long as this peak holds, we are looking for the trend continuation. And most of the times it will give you a great risk-reward ratio. So these are the examples for the sell. When it comes to the buy, it works in the opposite direction. I am looking for a sequence of highs and lows. I don't pay attention to which wave is stronger or not because we are not working with regular waves. Here we are working with Renko bars, which measures only the movement itself regardless of how long it took and the time. So this is the low of interest we have, and this is the low of interest we have, right? Yeah. As I mentioned before, ideally we want to clean, but because it's a Renko and not a regular scan, um, with a spike and everything, we can work also with the bounce. So what I like to see at that moment when it happens is that the moving averages of the DMAX RBA indicator crossing below the Bollinger Band to the upside. Once that happens— let's say a bit more accurate here— once that happens, it gives you a good opportunity and delivers many times positive risk-reward ratio. So it might look to you like, you know, like a holy grail. You know me for a while, holy grails do not exist. It's all about the logic and the combinations. Oversold conditions on cleaned highs, lows in a trend usually create situations of liquidity traps, and that's where high probability setups love to form. When you are in an uptrend once again mark like this, for example, right? This was the low, cleaned, and continuation. Then it created another low. So let's just refresh that like here, right? And it comes to retest. Look on the moving averages, and when they cross up, when wild below the Bollinger Band, this is your time to look for the buy, and many times with a great risk-reward ratio. So even though it might look like a holy grail, Of course, there could be fake setups, fakeouts, and that's something important to remember. Let's try it. Let's see. Like, for example, I want to show you an example so you see that this is not a holy grail, and yet some fakeouts could happen. Okay, let's take a look here. Okay, here we go. We are in an uptrend in that case. Right, making the higher highs, higher lows. This is a zone of interest, and it comes— and actually, it comes to cross to the upside, the moving average cross, as you can see. But it fails to gain good momentum, kicks out this low, right? And only then continues. So there could be some fake situations, uh, and fake signals. It, it happens. Okay, it's rare, but it could happen. So that's something to pay attention to. And, um, another thing which I want to show you, as I mentioned before, personally which I like, that's the combination of MACD with divergence. And I will explain what I love, um, seeing there. So divergence could provide a great, um, sign that something builds up and something happens. How does that look like? Um, let me just show an example here. So when the market actually makes these highs and then you can— you get here some sort of a double top, okay? So what happens then? You look at the MACD and this one gives you lower highs. These are situations of divergences. Now why do I like that? Because many times, not always of course, but many times this is exactly where the market makes the flip. And then you connect the lows of the existing trend or look for the reversals of the break of the previous lows, and that also could give you a great edge. Not always the moving averages, uh, would be above the Bollinger Bands of this indicator. That's why I wanted to show you also the combination of the MACD, and on the upper side This is the bullish divergence. For example, this is the most recent trend line breakout and delivers the rally. Took some time, almost cleaned the previous low, but eventually continued. Similar here, we got the bullish divergence: lower lows on the chart, higher lows on the MACD. The recent trend is broken. Last high is broken, and. Many times this move actually kick in and take place. So that's one way that I love working with as well. And I wanted to show you these combinations because it's just strong. So don't believe me just because I said take this indicator, test it out with the combinations of your analysis and your approach in trading and how you take the trades. I wanted to show you this indicator, to review it, explain where it's good, when it's not, what to pay attention to. Now, very important thing to mention here, it's also said on the page of this indicator in the store that try to avoid super volatile market conditions because we are talking about Bollinger ranges. And when the price goes out of these ranges and we expect the reversals, If the market is in a crazy momentum and just runs, runs, runs, runs, all this reversal, technical reversal signs would not work. That's something you would want to avoid. This is perfect in more realistic, slower market conditions when it's there more technical. Then the real power of these indicators is there. So that's pretty much it. I hope you find this indicator useful and helpful and. This approach to trading with the clearances and the crosses when the oversold, overbought conditions happen would help you in your trading. If you have any questions, don't hesitate, uh, to ask. We will be more than happy to, to answer and to assist. And thanks for watching. I wish you wonderful trading, and I'll see you soon with more trading ideas, trading education, and trading tips. All the best, good trading, bye for now.
More from Vladimir






Stop Buying USDJPY: The Critical Resistance You Need To See #forex #tradingstrategy #shorts




