BITCOIN Sell Trading Strategy Fully Explained - 4 Nov. 2024
4 Nov 2024 · 1 min
0:57
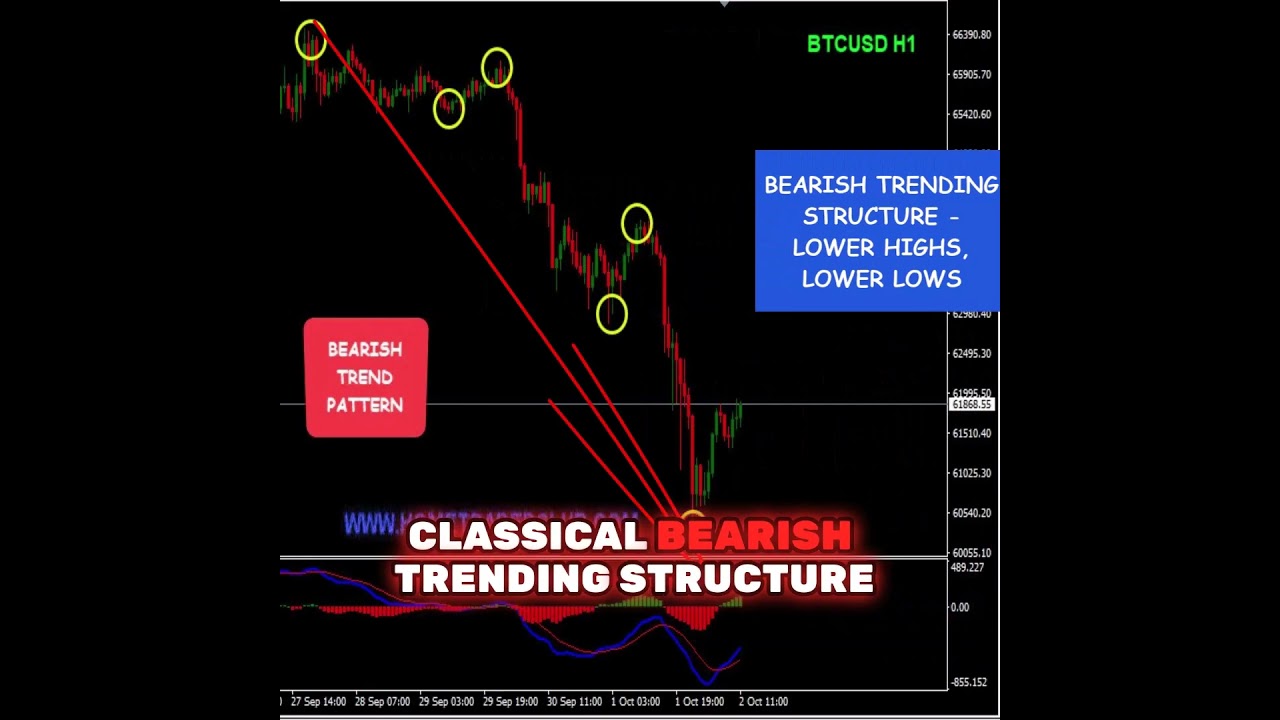
Vladimir Ribakov breaks down a Bitcoin short trade from October 2, using bearish MACD divergence and a broken downward trendline on the 4-hour chart. He sold rallies at the 61.8% Fibonacci level, which held and led to a 5,000-point drop.
Chapters
More from Vladimir






youtube.com
Stop Buying USDJPY: The Critical Resistance You Need To See #forex #tradingstrategy #shorts
2w ago




See all content
