BOS + CHOCH Indicator Review on cTrader | Price Action Strategy
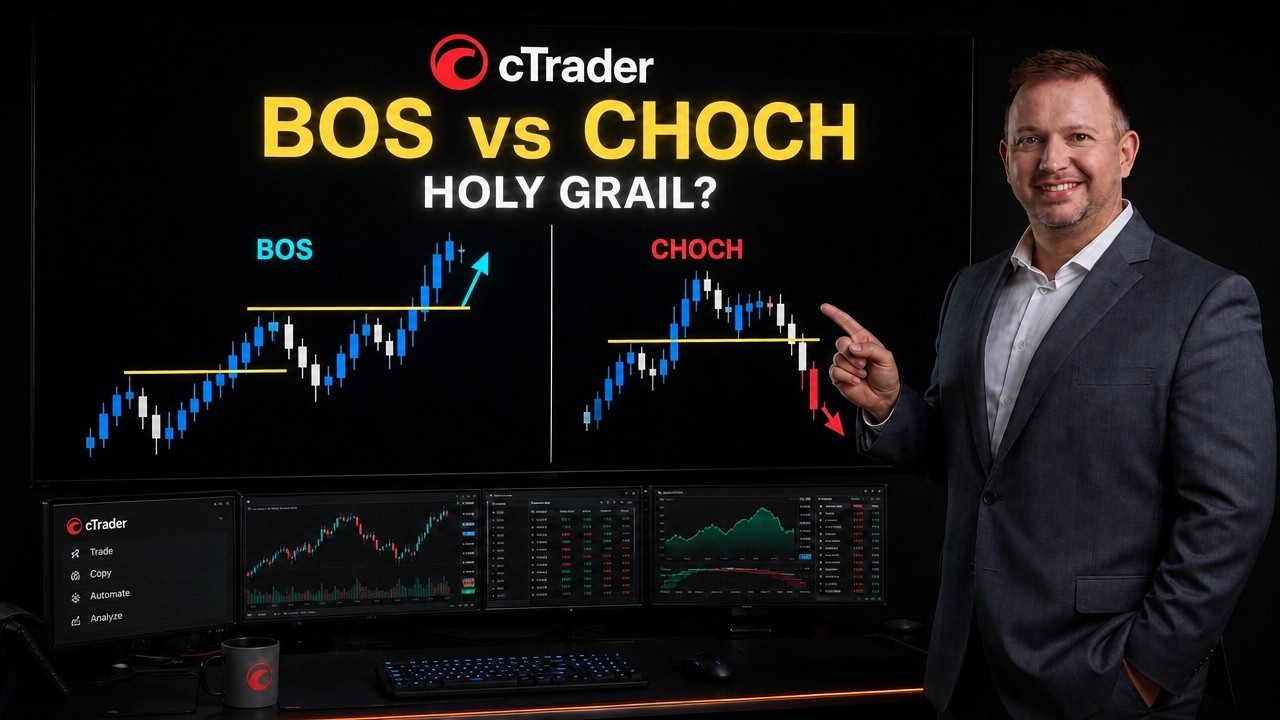
Vladimir Ribakov reviews the BOS and CHOCH indicator on cTrader, explaining how Break of Structure signals continuation while Change of Character marks the first reversal sign. He combines these with MACD divergences and support levels for entries, rates the tool 7-8/10, and warns against treating it as a holy grail.
Chapters
Break of structure, which is known as BOS, and change of characters, which is known as CHOCH, are two of the most used, most popular terms out there in forex trading, especially in 2026. Actually, not only because in the last couple of years it is so trendy. So in this video, I want to break it down. What is it? The BOS and the CHOCH, that are millions of videos talking about it, presenting it as the holy grail trading strategy. So in this video, let's break it down. Is it really a holy grail or not? Let's take a look. So hello traders, once again I'm Vladimir Ribakov from Home Trader Club, and if you don't know who I am, here is a little info about me. And of course you can watch here this video about my story all these years, 2 decades, 2 decades, believe it or not. And here I am with a little bit of knowledge as an international certified financial technician and 2 decades of trading experience. So in this video I want to break down what is it Two of the most used, common, popular, searched terms out there: the BOS and the CHOCH. Both choch, you name it, you pronounce it as you prefer. What are they? How actually they are used? So it's gonna be very interesting. But before the chart, this video would be presented on CTrader platform. And as you can see here, this is, uh, this is a built-in indicator. Well, not exactly built-in, but it is from the cTrader store. To be more specific, this is the indicator. So as part of my playlist I created for you about cTrader, which you can watch here on the channel, talking about the platform itself, talking about trading strategies, how to use and implement on cTrader platform. As part of this playlist, I would also be reviewing their built-in features, their products from the store, so you have all the needed, relevant, important information to see if this is something that could be beneficial, helpful to you, or not. So this indicator I've been testing, BOS and the CHOCH indicator, helps to spot these very conditions. Break of structure and change of characters. And I'll show you how this indicator is actually, or meant to be used, and how it could be helpful to you. But before that, why cTrader? I can talk about that hours. I've been testing it for— this is the second year now, I think. Superior platform. Here are all the reasons why cTrader is becoming, maybe already, A top platform for retail traders. So what exactly is this tool, the change of character and the BOS, which is the BOS, the break of structure? So the idea is very, very simple. And before we dive into that and dig very, very deep, here is the maybe not so pleasant truth to hear about that. Recently, recently, several years now. There is a new trend to use some bombastic initials, put it together, present it like the Holy Grail. It happens with the fair value gap, FVG. It's everywhere. It happens with this BOS, CHOCH, and everything. What can I say? The marketers that create these videos are brilliant. They come up with some idea, they put some titles to that, they make some initials, and voilà. They have a concept that it's easy to sell and make everyone else to believe that this is the holy grail. The truth is that's bullshit. It's an absolute BS. And the reason for that is because these have been, all these concepts have been in the trading world since forever. There is nothing new here. It's a very simple concept of price action. And once you understand that, you would see that the only thing, and I have to admit, it looks good when you see on the charts BOS, CHOCH, and ah, now something's going to happen on the market. So you have to be smarter than that and do not let all these beautiful initials confuse you and make you think that this is a holy grail. Do you remember when the harmonic patterns came first? That was such a crazy hype. Everyone was talking about that. Everyone was trying to convince that this is the only method to use, but the reality is it was just one way to use Fibonacci expansions. So once you understand that all these tools, all these initials are part of something that exists forever before me, before you, before everyone else since the market actually exists and the charts. Were created. So the idea of the BOS, break of structure, is a trending structure. So the idea here is when you have sequence of highs and lows in the same direction, you are in a trend. Higher highs, higher lows, bullish trend. Lower highs, lower lows, bearish trend structure-wise. So when the break happens, break of the structure In the direction, it's called BOS. As simple as that. And that happens in healthy trending conditions. And then logically, we would be looking to buy the retraces. While the CHOCH or the C H O H is the opposite. When you had the sequence of higher highs, higher lows, and then the market makes lower lows, this is a first sign that the trend might be. Actually reverses. Okay, so as you can see on this very image, uh, this is an example of a bearish change. It was an uptrend sequence of higher highs, higher lows. Then we got to the change, lows are broken, and we got the change of character. While the break of structure is when you have sequence of higher highs, higher lows. So with that idea in mind Let's break each and single one of them down. So this is a sequence of higher highs, higher lows, and as you can see here, the structure is broken. A change of character from an uptrend. We start to see the first sign, the initial signs of lower lows, and this is the very first sign that the trade might be losing momentum, and we could enter or trend change or some corrective phase. Okay, so this is how it happens in the uptrend. In the downtrend, it's slightly the opposite. From lower highs, lower lows, we got the break above the recent low, and the character changes, the trending structure changes. Now from lower highs, lower lows, you suddenly have higher highs, and that's a potential sign that the trend could be actually reversing. As simple as that. Okay, so these are very common concepts. Let's admit it, it looks impressive when you see this choch on the chart or BOS on the chart. It looks, uh, kind of luxury. It looks kind of promising that some setup might be there, but it's just a very known concept and yet very powerful. And to be very honest. And for those of you who follow me in this very channel, you know how much I love the reversal structures, especially when it happens right on key trading levels. This is one of my best weapons I have in combination of multi-timeframe divergences and cycles. And if you want to learn all my trading techniques and enjoy them when I present that in real time, you are very welcome to join our family in Home Trader Club where you would be able to enjoy all of our complete and comprehensive, uh, trading courses. You would be able to enjoy our real-time trading opportunities come to you in our trading journal, comprehensive videos on so much more. Join our family with the link below this video in the description. So now that we understand the, uh, CHOCH, let's see what, uh, the idea is when it comes to trading the CHOCH. So the most common one is when the trend flips, and from sequence of higher highs, higher lows, it starts to make the lower highs. What you would want is some pullback and retest, and from there look for the sell opportunities. And the opposite is at the end of a downtrend when you have sequence of lower highs, lower lows, and then you got the CHOCH, the change of character. Then you would be looking for pullbacks and look for the opportunities to buy with the trend. So that's the basic idea of the CHOCH. Now, what is the BOS in that case? The break of structure. So this is relevant in trending conditions when you have sequence of higher highs, higher lows, and you got the break above the recent high in the given— the previous swing high, yeah, in a given direction. That's a break of structure in the given trend. And the understanding here is that the market will be trying to continue with trend in a lower highs, lower low structure. When it goes below the low, and then with pullbacks, you would expect to see further continuation down. That's the idea of the BOS. And when it comes to trading, the logic is simple. You got the sequence of highs and lows, you got the price above that, you would want to get there, get in either with the break or with the pullbacks, and expect further continuation in the given direction. It is very powerful when it happens in combination with CHOCH, which I'll be showing on the charts in few moments. And for bearish trend, when you have sequence of lower highs, lower lows, the market breaks below the recent low— that's the break of structure— and after retraces, you would be looking for further continuation down. And we would see in a moment how that looks like on the chart together. So going back to our indicator, which is once again could be found in the cTrader store— by the way, if you don't know where it is, check the description in this video, I'll put the link there for you— and see if you like it and if it could be helpful and useful to you. So the idea here is this indicator helps to spot these very conditions. Okay, now here is the honest review. Is that perfect? The answer is no, because it is based on specific trading conditions, most likely with fractals. So there are some, let's say, misperfections. For example, like here, that's not a real charge to me because this is the real high, but the indicator is treating this high. So of course you have to be smart and understand that, okay, not all of them could and should used. So what are my preferred conditions when it comes to trading with this indicator? So my favorite way when it comes to change of, uh, trend or change of characters is when you have sequence of highs and lows in a given direction, ideally with some breaks like you can see here, break of structure in the given direction, and even, even here Break of structure, right? But then what I love to see happens right after that is when the market flips and makes the change of character. Then look what happens here on this BOS, on this break of structure. The market makes higher highs, but as you can see here on the MACD indicator, we start to see lower highs. This is a condition of bearish divergence, and it's very, very, very, very, very Very powerful sign. And then when we flip and make the lower lows, the change of character, what I like to see is pullbacks back to the broken low through the high where it was break of structure. Right there inside, I want to see the bearish candles rejection. And once these candles rejection happen, which we can see right here inside this box, this is a great sign For further continuation down. Then of course we start to see break of structure, which means the market breaks below the lows, which to us is a sign that sell the rallies is the direction we want to trade. Okay, so this is the combination which I personally like the most. Let me show it to you how it looks in the opposite direction. Like here, for example, we've been going here with some bearish trend. Lower highs, lower lows, and then at some point we got the change of character. The indicator spotted in that point because this is probably the recent fractal. To me, this is the real change of character. Once that happens, what the market starts to do is making higher highs, retraces, and again, again, higher highs. This is now break of structure, so it flips from Look at that. This is a very, very, very, very powerful thing and concept. Break of structure, break of structure, because we are in the trend, right? We are making the lower highs, lower lows. So this is a break of structure, but then the indicator, the MACD in that case, makes higher lows. That's a bullish divergence. Then it goes and breaks above the recent high. That's what you tell me. Change of character. Exactly. So now we have the higher highs once again. I, I said it before, is the indicator perfect? No, there will be some inaccuracies, I would say. Uh, like in that case, to me this is the real high even though it treats it as this point. It doesn't change anything in, in that case specifically, but it's important you pay attention to that. And like any other indicator, it comes to indicate The price is what dictates. You need to understand the concept. This is why I explained the concept at the beginning of this video, so you know what to look at and not blindly rely on the indicator. Okay, uh, so, um, once again, you got the bullish divergence, then the change of character, which means now we should be looking for retraces and bullish candles to form to give us the idea of the buy. And then when you got break of structure, break of structure, all these provide you the opportunities to either add on or to look for fresh positions in the given trending conditions or trending direction, which in that case is bullish. So this combination, when it comes from trend to change of character, then break of structure in the given trend, is super powerful. And also when you use that in the main trend, take a look what happens here. You don't need to be genius to understand the market here is under a bearish momentum. Okay, it's obvious, it's screaming, it's pretty clean here. Sequence of lower highs, lower lows. So when you get some pullbacks and then you have bearish change of character here, and then here, right, when it flips and make the lower, lower lows, or here once again, right, and then change of trend, these are all the places where you actually join the bearish trend And that's a brilliant opportunity to look for signs to join ongoing trend. So the bottom line, what do I think about this concept? No BS, this is one of the most powerful weapons I have, in a little bit different combination with multi-timeframe divergence and key trading levels or cycles. And that's one why I mentioned before, if you want to learn more about that, you are very welcome to join our family, the Home Trader Club, with the link below this video in the description. Um, it's a superb concept, and that's why for me it was very important not just to review the indicator. By the way, I personally give it 7, 8 out of 10, which is from my point of view great, uh, rating. But keep in mind to miss accuracies, keep in mind to these little details. Sometimes it's not perfect. That's why I wanted to explain the concept at the beginning And then to show it to you how I personally like to use that. So you know when they when you see an indicator a little a little misaccuracies, a little you know not not not perfect spots on the indicators. Always remember indicator indicates price is the one that dictates. So that would be it for this video. I really hope you find value in this video and once again I want to remind you. On this channel. You can find in the very— in this very playlist of cTrader, you can find all the videos there about cTrader platform and why it is so great for us, the retail traders. You can find there different strategies, different techniques, and different approaches how to use the built-in features. Now I would like to thank you for taking the time to watch this video. If you liked it, make sure you hit the like button. And if you are new to this channel, make sure you subscribe with the subscribe button below this video. Stay tuned for more educational videos to come and great trading opportunities we upload right here for you in this channel. Thanks for watching. Thank you for your time. Best to you and yours, and I'll see you soon with more. Good trading. Bye for now.
More from Vladimir






Stop Buying USDJPY: The Critical Resistance You Need To See #forex #tradingstrategy #shorts




