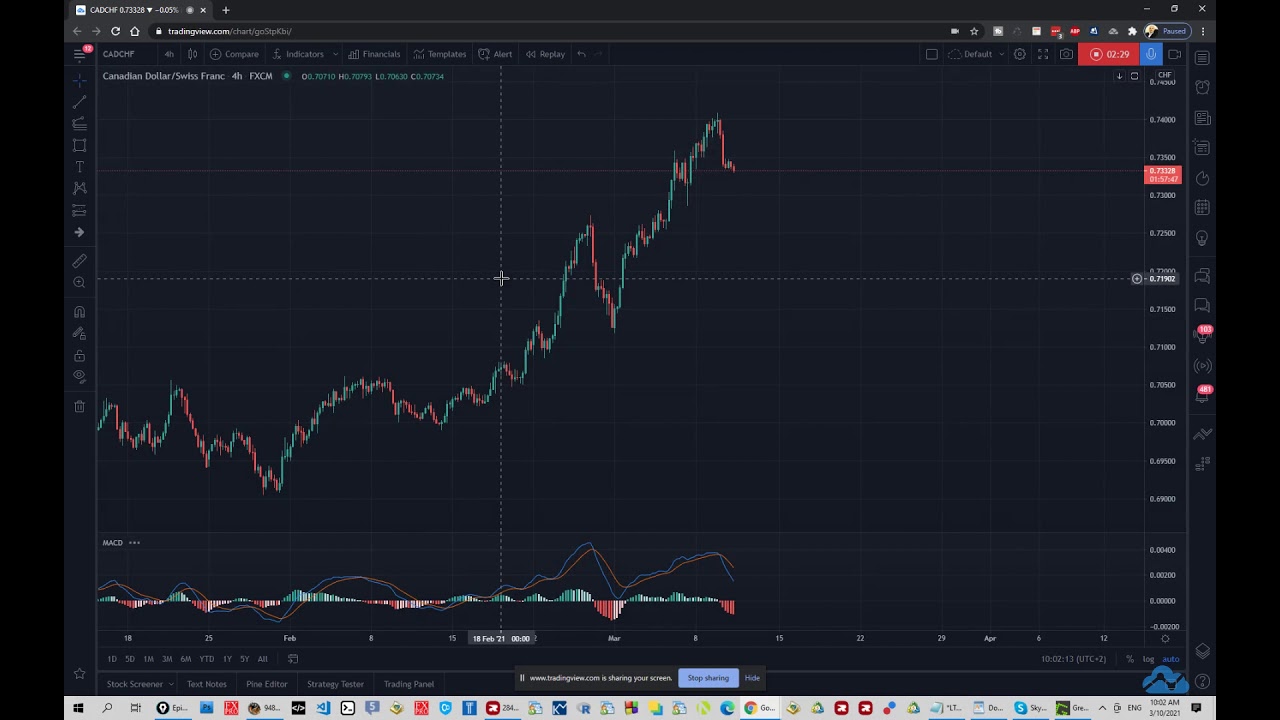
Vladimir Ribakov analyzes CAD/CHF after a move into a dense consolidation zone. He spots bearish divergence on 15-minute and 4-hour charts, a broken Fibonacci 100% level, and an engulfing candle suggesting rejection. He targets intraday entries around 73.50-73.60 for a short-duration sell-the-pullback trade.
Chapters
And in this video, we're going to talk about CAD franc. Basically, what we're seeing here since a week or two is that the price is pushing to the upside. We're coming closer to these levels, and honestly speaking, we do have a pretty decent level here. Let me just find the rectangle. So I would say that in absolute terms, this entire zone right here, this consolidation zone, that would be the, um, the most dense zone where we have most of the volume, right? And we're somewhere near the bottom of this level. So that's the first thing we're reaching— weekly levels. We have actually reached those levels. And we can expect for the price to give us a pullback. Now, whether we're going to do something like this and probably continue higher, or we're going to stop and continue lower, we don't know. We might argue about that based on the higher time frames, which would make sense to continue here, of course. But in the shorter term, what we can do is take advantage of these levels and the situation which is currently being presented. So the first thing I'm going to do is drop here the Fibos, and we can see that we've got, uh, the 100% broken. Okay, and now we have a potential reversal, a rejection coming from this 100%. Okay, so yesterday's close below Starts to look very good. We have this, um, kind of engulfing candle here. I'm not sure if it actually— no, maybe it didn't close below. I don't see it well, but it doesn't matter. The overall idea of this candle is that we have plenty of bears on the way. Plus, as I said, the 100%— excuse me— is being rejected. Now notice that there is no divergence yet on the daily chart. Okay, so we are looking at potential pullback and possible continuation. This is really, really important. I'm not expecting this thing to go ahead and crash. I'm simply expecting pullbacks. So that being said, moving to the lower time frames, and this is where we start to actually find, um, divergences. Okay, so the divergence basically started from approximately here. This is the first time we reached the top and we had something like that, right? So at least on the histogram, we might say that we had divergence from that point on up to here. It managed to remain under bearish pressure. So as opposed to this, for example, right, where you might be starting with divergence But then it switches and breaks this level to the upside in terms of indicator. We're not able to do that here, okay? There is lack of momentum, there is lack of bullish support. This is what that means for me, and that means once the trigger is there and once this mini bubble is bursted, we should be looking at pullbacks, this to come to equilibrium again buyers to, um, to gain control, right, to gain the volume. And then we're going to probably see the continuation to the upside. So what we can do in this case is try to catch this move down, which would be more aggressive of course because now we're dealing with pullbacks. But take a look what's happening on the even intraday time frames. We're starting to build here Uh, impulse. Okay, so after this structure is completed, and if this analysis is correct, uh, that should be the first, the third, and now the fifth wave. 4, 5, right? Pullbacks and down. So basically what I'm trying to say is I do expect to see something like this being developed, which means If I'm going to be selling, I want to be selling the pullbacks. The way to do that is very simple. We need to first of all figure out where the levels are. Now on the lower time frames, I definitely see this zone right here as a level. This is the 73.50, 73.60 approximately. Okay, I would also go to the 4-hour chart to make sure I'm not missing anything. And in terms of targets, now the second wave— if this is going to be 2 waves rather than one straight push down— the second wave we can start predicting based on the Fibos and projections and all that. But we need to see, uh, this pullback happening first. Until that happens, we have no clue how it's going to develop, right? So we cannot really project to that point. What we can do though is Um, figure out the levels on the way down. Now these levels here, they are too far away, but the spike and this spike which are kind of forming here a zone for us are right there. In other words, if I see this move going and doing something like that, right, and then starting to bounce, I will probably not be interested in trading it. Of course it depends, but the idea is this to play as our target, okay? Not as the support where we look for the bounces. We want to catch this initial move to the downside, right? Because again, we're expecting only a pullback. That's why we want to get in and get out as quickly as possible. Pullbacks are always riskier And you remember that you're going against the main trend, plus the reversal confirmation, right, uh, is coming only from the 15-minute chart here. We don't have anything serious on H1, H4— well, serious in terms of intraday trading. So let's see if we can get some kind of pullback here and if the risk-reward ratio versus this zone would start making sense, plus if we get some nice interesting setup during this pullback, we might be looking for possible sells. So that will be all. If you have any questions, please leave a comment below. Thank you for watching.