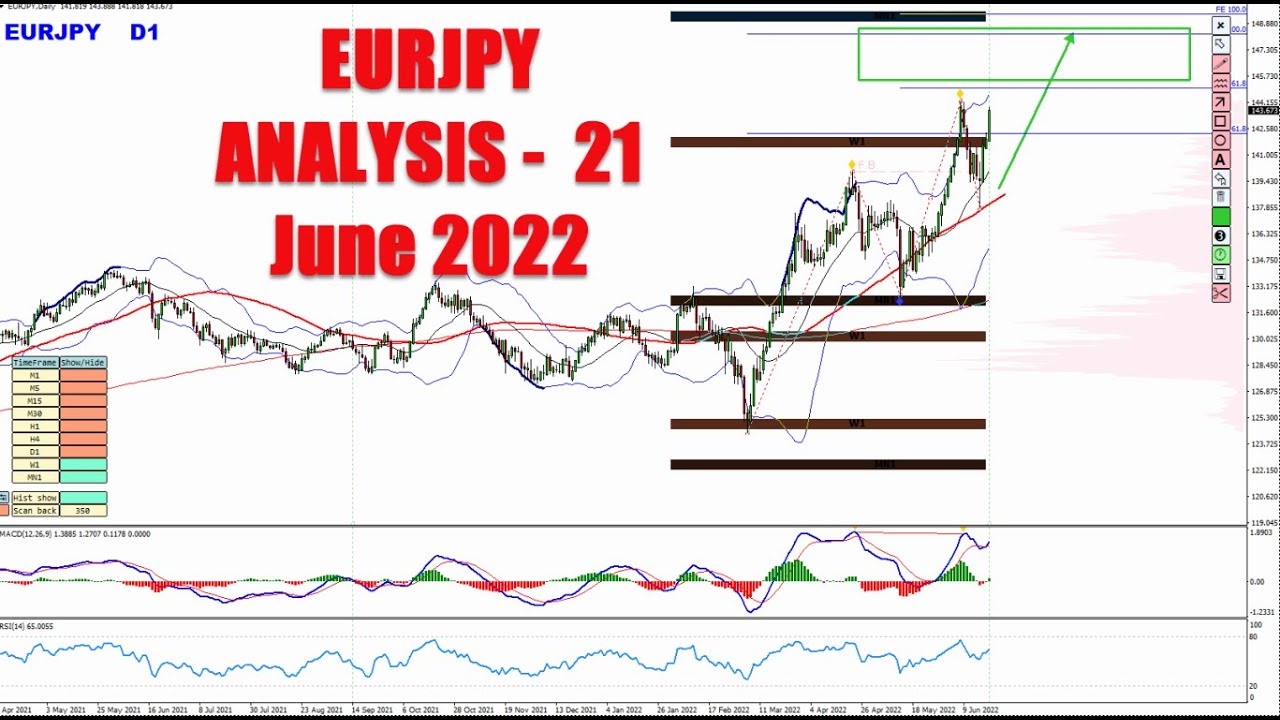
Vladimir Ribakov analyzes EUR/JPY using monthly, weekly, daily, and 4-hour charts. He identifies a large Fibonacci expansion "magnet zone" aligning with swing highs and sees no bearish signals like MACD divergence, supporting a buy-the-dips stance as long as key support holds.
Chapters
Hello traders, how are you? Vladimir here from Traders Academy Club, and in this video I would like to share with you my analysis and price prediction on EURJPY. Before we go over the charts, if you are new to this channel, welcome to our amazing community. Please subscribe with the subscribe button below this video, and also I welcome you to our trading family, Traders Academy Club. Where you will enjoy from, as you can see on this very image, a full free VIP price action course, real-time trading ideas, real-time trading education, and our amazing trading community. Join our family with the link below this video in the description. And now the EURJPY. So after a massive rally that we experienced over the last several months, the biggest question that always comes up is, is that the end? Where will that end? So personally, I'm a big fan of speaking with the charts, on talking on the charts, and not trying to do some bombastic predictions. I, I believe that goes with the facts rather than with wishes and, uh, and some sort of beliefs is the smartest decision at the moment. Despite several— and I repeat, despite several Potential signs that we've had against the rally continues. These signs never managed to yet send some roots to the ground and and create something really major in the opposite direction. The question is how much more will that continue? Now, as I said before, I believe in in chart, in facts, in in official information we have on the chart. Right now, what do we have? So despite what happened in April and May, despite of this slowdown with divergence, we got ABCD correction. And since then, the market continues making higher highs, higher lows. And do we have any signs it's over? The answer is no. Japanese bank still continues with what they do. And it's something that I personally feel very sad about because this could blow up in the face of who? Not the central bank, the people, uh, with this massive weakening they do, with this massive money printing. I, I, I afraid that such experiment could really fail and have very negative impacts later on. Uh, so at the moment, that's what it is, and, uh, bullish momentum carries on, and I expect that to continue until the next things will happen, which I would want to explain now. But 2 things before that: if you find such videos helpful and useful, please make sure to hit that like button below this video. If you have any questions and, uh, or anything to say, to share from your view, please leave your comment in the comment section below. 20 seconds of your time is huge help to me, my work, and my channel. So I hope Um, to see your support. And thank you very much, of course, in advance to all those of you who do. So at the moment, what I see in terms— again, only the official facts on the chart, okay— the next important swing highs on the go as it continues from the monthly chart are here, okay? The last highs of this uptrend. Afterwards, as you can see, there are no technical barriers, but these levels could really be problematic or at least cause some slowdown until these levels are reached. As you can see, from one side it looks like close, from other side it's far. We are speaking here with big ranges. This is the monthly and the weekly chart. So taking a look on the levels, there is still room to go. Watching on the indicators, we can currently see that there is nothing Showing it's over. There is no divergence on the moving average of the MACD, a condition where we have higher highs on the chart versus lower highs on the moving average of the MACD. Oops, just go back to draw that. Okay, so these are the levels from the monthly chart as we discussed. By the way, as you can see, this tool I am drawing with Uh, is available for you. You can go and download it. This is my virtual trading pen. Below this video in the description, you can find 2 links there, the virtual trading pen and the KTL indicator. You can download that, install that. They are available also in the free version. Uh, so just below this video in the description, follow the links, install, and enjoy them. So, um, again, levels are there, divergence against, or signs against for a slowdown. Does not yet exist. In terms of price action, the structure is pretty clear. We are creating higher highs, higher lows. No real doubts about that. Going to the daily chart, here is where it starts to be interesting. The daily shows a potential divergence if this sorry if this high would manage to be created and on the MACD as well. This is a potential divergence, and that's What I would be expecting to see from the euro yen, and here is what I want to show you. I delete everything in order to show you how it can fit. So connecting the highs on this ongoing uptrend, okay, and you will see something very interesting. Check this out. Let's put the Fibonacci expansion levels, okay, and note. We already bounced off the 61.8, made a correction. Now we are going above it again. Very possible scenario is we can carry on until we get closer to the 100, not necessarily touch that, but get closer to that. And if we plot the Fibonacci on the current leg from this, this low to this high, Okay, you will see a beautiful zone here, okay, of expansion and a magnet zone, combination of 2 different waves, independent waves, okay. Um, and look at the Fibonacci. This is the expansion of the smaller Fibonacci. This is the expansion of the bigger one. This is a massive zone. It also fits with the swing highs we saw on the monthly. It also fits with the swing highs here and the trend line connecting the highs, the ongoing developing dynamic resistance line. So I believe we should get inside the zone, and it's impossible to put the finger on the exact level, but this is a zone here, and I believe this, this one has room. Taking that into consideration, let's go to the 4-hour chart. And watching on the 4-hour chart, we also can see that there is nothing against. And that makes me think that any pullback should provide an opportunity, a legitimate opportunity to look to buy and to continue to ride with the ongoing trend until the signs against would be completed. So this is my view on the euro yen. Buy the dips. Um, is still the valid view, as low— at least as long as this low holds. This is at the moment, um, the low of invalidation. But I think there are some important zones to pay attention to besides this low. The first one is right here, the volume zone of the weekly and daily chart. And once again, you can download this indicator, the Volume Profile indicator, below this video in the description. Okay, this is the first zone. And this is the second zone, also the volume from the daily, but also the lows here and here. Pretty strong areas. As long as they hold, for me, buy the dips on the lower time frame could be the classical opportunity to go and to ride with the ongoing trend until once again these daily highs would be completed. Divergence would complete, and then we would have to take the profits. Of course, if the opportunity is right, and look for the reversal signs, because eventually we want it or we will not want it, the reversal signs will take place eventually, and then we would be able to find an opportunity to ride with the future sells. Let me know what do you think about the euro yen. I wanted to share with you my view and why buy the dips is the direction I am looking to trade. And once again, welcome to our family, Traders Academy Club. You can join us directly with the link below this video in that description, and I hope to see you with us. Thank you for your time. I wish you and yours all the best. I'll see you soon with more. Bye for now.