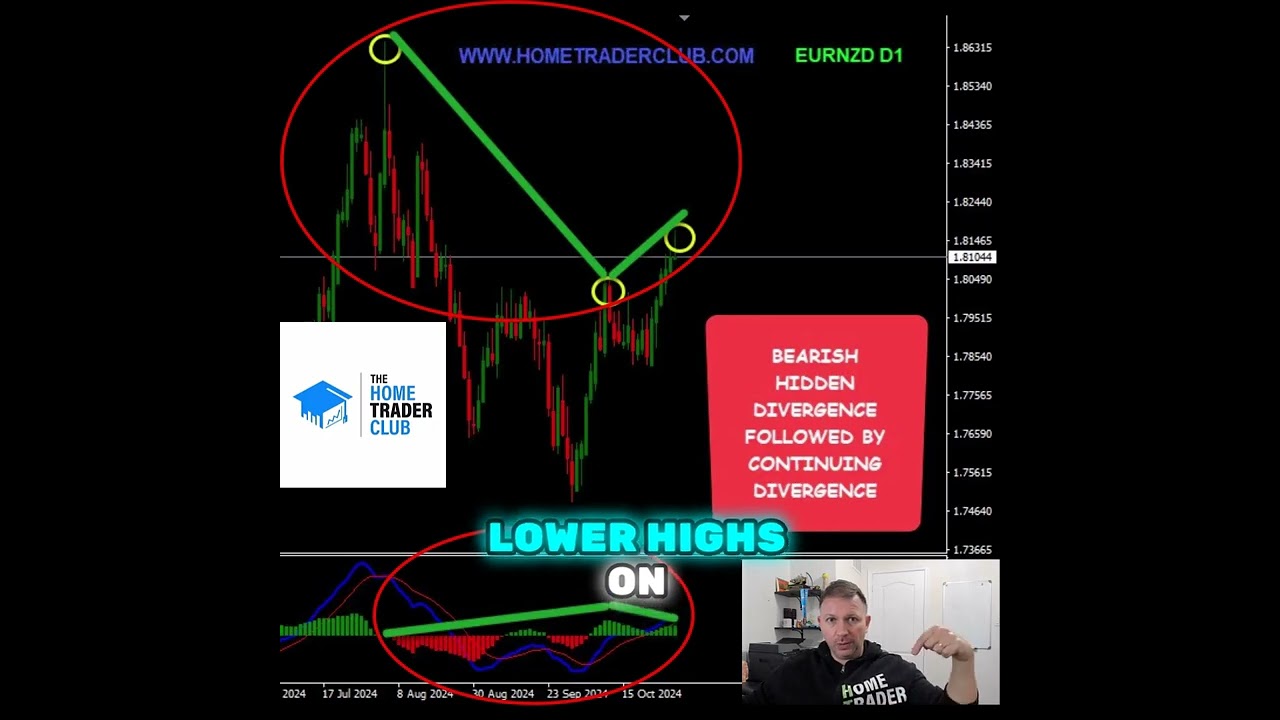
Vladimir Ribakov breaks down a EUR/NZD short trade setup using a hidden divergence on the daily chart, where price makes higher highs but MACD makes lower highs. The 61.8% Fibonacci retracement provides entry, targeting over 300 pips downside.
Chapters
Here is why we took the EUR/NZD sell trade, and here is the trading strategy behind it. So this trade was published in this very channel on October 30th. We spotted bearish trending conditions on a daily chart— 3 lower highs, lower lows— with a beautiful bearish hidden divergence, which turned to be a basic histogram divergence— higher highs on the chart, lower highs on the MACD histogram. This divergence was confirmed on the 4-hour chart by the moving averages of the MACD, and we got a beautiful Fibonacci level 61.8 holding this zone. This is a classical by-the-book sell opportunity, and as you can see, the EUR/NZD does not disappoint and delivers over 300 points to the downside from this level. For more real-time trading opportunities, complete trading courses, and real-time trading education, join our family, the Home Trader Club.