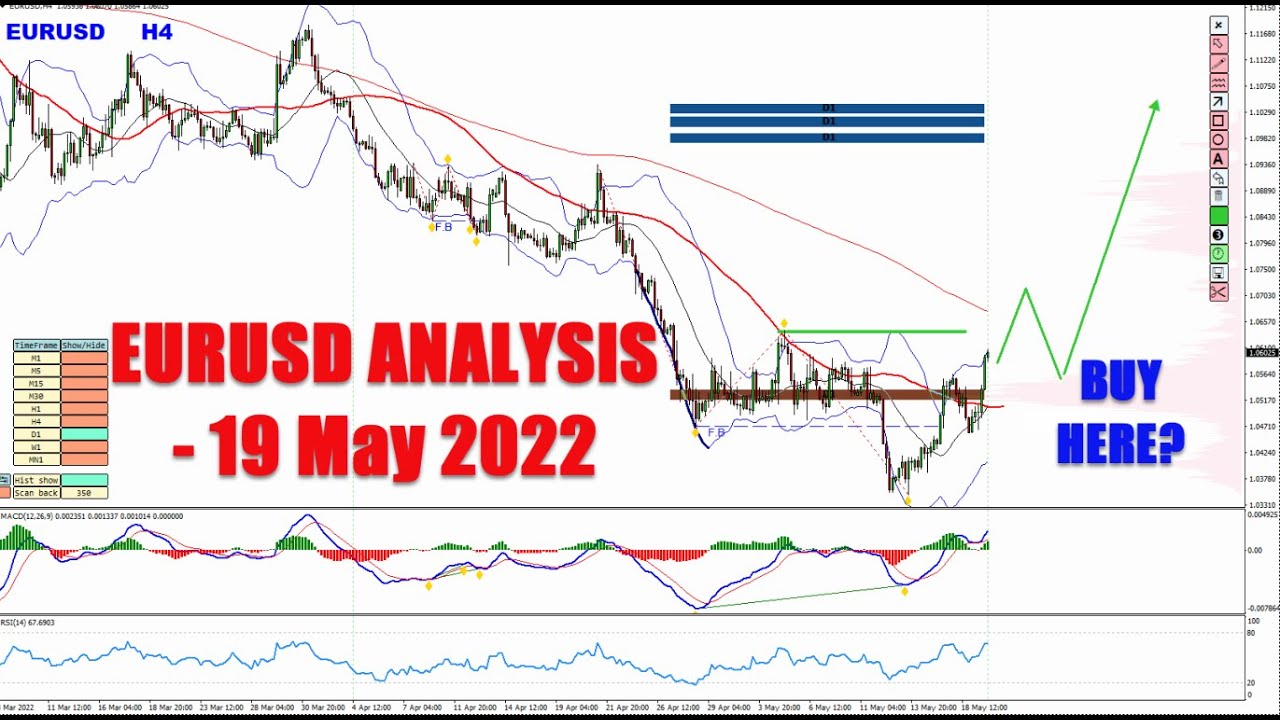
In this YouTube video, Vladimir Ribakov of Traders Academy Club delivers a detailed technical analysis of the EUR/USD currency pair and outlines his bullish price forecast. He begins with a channel introduction, inviting viewers to subscribe, join the Traders Academy Club, and download two free indicators – the KTL Key Trading Levels (Volume Profile) and the Virtual Trading Pen. Ribakov then examines the weekly chart, highlighting a large support zone and a developing histogram divergence that pressures sellers, suggesting an upside correction. Moving to lower timeframes, he points out two false breakouts, multiple divergences (moving average, histogram, RSI), and a strong three‑white‑soldier candle pattern. On the 4‑hour chart he notes a moving‑average divergence and a key high that, if broken, could trigger a buying opportunity. He defines target zones using daily and multi‑timeframe volume areas and dynamic moving averages, projecting a first target near the daily volume area and a final target near weekly/monthly volume zones. Ribakov also discusses a downside scenario where the pair could lose momentum, break a trend line, and experience a corrective dip before resuming the downtrend. Throughout, he repeatedly promotes the free indicators and the Traders Academy Club community, encouraging comments, likes, and shares.
Chapters
Hello traders, how are you? Vladimir here from Traders Academy Club, and in this video I would like to share with you my analysis and price prediction for the euro dollar. Before we start and before I explain all the analysis and the trading technique I am looking to apply here and explain why If you are new to this channel, welcome to our amazing community. Please subscribe to the channel with the subscribe button below this video. And also I invite you to our trading family, Traders Academy Club, where you will get your access to our free full VIP price action course where you will enjoy all our trading ideas delivered to you real time, and mainly our real-time trading education. What does that mean? Every single trading opportunity comes with a detailed video explaining all the techniques behind this trading opportunity and fully track recorded and followed up, of course, in our dedicated trading journal. Join our family with the link below this video in the description right below the video. And now let's go to the charts. Euro dollar, what do we have here? And also, of course, before we do that, if you find these videos useful, helpful, educational, and you benefit from them, please show your support. Hit this little like button below the video. Uh, your help, your support is very much needed, very much appreciated. If you can, some feedback in the comment section would make a great help to this channel as well. Thank you very much in advance to all those of you who take the time and to help. Also feel free to share this video with anyone who you think can benefit by watching it. It's open for the community, of course, so feel free to share. So what do we have on the euro dollar? First of all, very interesting Uh, supportive zone. And if you also are new to this channel, you still didn't download these 2 indicators I use, the Virtual Trading Pen and the Volume Profile Key Trading Levels Volume Profile indicator, available for you for free download below this video in the description. You will find the link, KTL indicator and Virtual Trading Pen indicator. So a massive supportive area on the weekly chart and And as we can see at the end of these waves here, we have some histogram divergence developing. It puts some pressure on the sellers and I expect to see a correction to the upside happening. So massive supportive area. We are going and bounce above the area of 105. And if we drop to the lower time frame, here is what we see. So 2 false breakouts coming in play. The first one, if we connect the lows, this becomes a false breakout, fake low. Moving average divergence, histogram divergence, RSI divergence as well. Right now we got more than 3 white soldiers here. That's 3. It's a very strong candle pattern, and right now the, the price is trying to establish itself above this volume area. So here is how I see that taking place from here. Dropping down to the 4-hour chart, we also can see a moving average divergence here, and this is our key high. Breaking above this high to complete, uh, 2 waves should open the doors for a good opportunity to buy the retraces all the way to the next desired levels. What, what are the next desired levels? If we go back to the daily chart, you can clearly see that this low and the next high create a volume area, okay, and the first significant zone. And it is, as you can see here, in between the 2 massive dynamic, uh, um, trending moving averages. So this would be the first target zone. The final one for this rally would be pretty much here next to the weekly and the monthly volume areas. Once again, I would like to remind you this volume profile based indicator is absolutely free. It's called KTL, Key Trading Levels indicator, and allows you a multi-timeframe control, uh, within this one table. Also this beautiful virtual trading pen for a multi-timeframe easy analysis and many more amazing features here with this toolbar I developed, available for you for free. Download them below this video in the description. You will find the links. So this is how I see the euro dollar and my bullish scenario. Now, can that go wrong? And the answer is, of course, the market not always goes and agrees with the scenarios as we have them. The other scenario we might have here, it's if it slightly doesn't gain any momentum and just reverses to break this trend line and the low, then it could be a sign that we are going for one more dip before it retraces. Very important last thing. Do I think that this is over and the trend about to change? The answer is no. I think we should be experiencing a corrective movement within the next period. And then I believe the further move down should continue next. So this is my analysis on the euro dollar. Let me know what do you think about this pair. Share with us your inputs, your analysis, your expectation with your comment below, with your comment below this video in the comment section. Thanks for your time watching this video. I hope you find it helpful. As always, Um, I wish you and yours all the best. Once again, welcome to our trading family, Traders Academy Club. Join us to enjoy all the best offers and value we have to offer you with the link below in the description. All the best, see you soon with more.