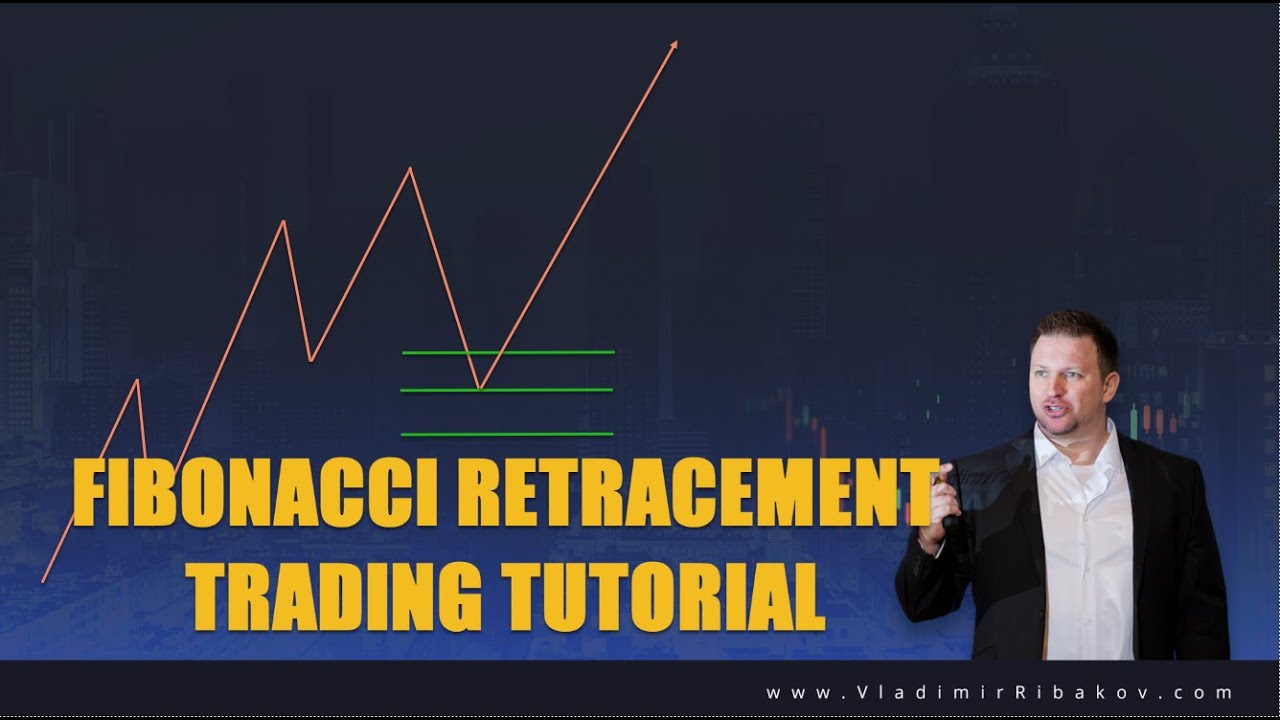
In this tutorial Vladimir Ribakov walks viewers through a disciplined approach to using Fibonacci retracements in trending markets. He begins by emphasizing the need for proper multi‑timeframe analysis—identifying bullish divergences on daily, 4‑hour and 1‑hour charts, and confirming key swing highs/lows with his proprietary indicators (Virtual Trading Pen and KTL – Key Trading Levels). He then demonstrates how to correctly plot Fibonacci on a genuine wave, warning against random placement. The core of the lesson covers selecting retracement zones (typically 38‑61.8%), deciding when to enter with market orders versus pending orders, and aligning Fibonacci levels with volume‑profile zones to improve probability. Risk‑reward considerations are discussed, with a preference for the 38‑50% range, and he explains how to set protective stops below the 61.8% level. Throughout, Ribakov stresses the importance of treating price as the driver, avoiding greed, and using each tool only as intended. The video also includes calls to action for his free VIP price‑action course and downloadable indicators.
Chapters
Hello traders, how are you? Vladimir here from Traders Academy Club, and in this video I would like to talk about the Fibonacci retrace. How and when can you enter using this absolutely amazing tool? But as every tool the tool can perform well as long as it's used in a way it is supposed to be used. And for that, I record this video to give you some very valuable, very important tips what to do, because a lot of traders just plot Fibonacci really without understanding what to do. It always reminds me seeing teenagers going to gym and trying to copy some Instagram, uh, um, influencers because they saw something. So I want to give you the extra tips here, what and, uh, how the Fibonacci should be applied, mainly, uh, why. And, um, we'll give you extra tips. When can you use pending orders with Fibonacci? When should you work with setups based on Fibonacci retracements. Let's discuss about that all. But before that, if you are new to know my channel, welcome to our amazing community. Please subscribe with the subscribe button below this video. And also I invite you to our trading family, Traders Academy Club, where you will get your access to our full VIP price action course. You get it absolutely free. You also will enjoy from all our real-time trading ideas and real-time trading education. Every single trading idea comes with a detailed, dedicated video explaining the exact techniques behind it— what, why, how, and when. So join us, join our family with the link below this video in the description. And now let's go to the charts and to present my, um, technique here. I want to go directly to my trading journal, uh, all the trades I share in Traders Academy Club, and I want to take the most recent trade we, um, managed to enjoy from. This was the New Zealand CAD. Okay, so the idea here, as we were, uh, at the beginning of the move, we want the buy the pullbacks ideally to this beautiful area marked here and then start the buys towards the next key zones. Okay, now these levels are not random. I choose them for a reason. One of the reasons, of course, this is the pair, as you can see, followed our plan here pretty much as we wanted to see back to this zone, the volume zone. Okay, and the rally. So what is coming, uh, here is the, the importance of multi-timeframe analysis, of correct read of highs and lows, trending structures, and then you apply indicators like the volume profile I work with, like the Fibonacci, etc., etc. Not before you do your price analysis. And it's important to understand because many, many traders simply tend to forget that indicator's job is to indicate. The price is there to dictate. You have to remember that. Okay, now, um, what did we have here? Quick analysis to give you a brief idea why at all I was looking for a buy. So, um, analysis was very simple. We got a waving structure on a daily chart. Look at this monthly zone here, found right here by my indicator, the KTL indicator, which by the way, uh, these 2 indicators you can see on my, uh, on my screen here, okay? My virtual trading pen, the pen which I draw with on my multi-timeframe, I draw on my screen. Uh, and the KTL, Key Trading Levels indicators, with a multi-timeframe control. As you can see, I can control everything from here. Absolutely amazing tools. Uh, you can go and download them below this video in the description. Found the link, okay? Uh, Virtual Trading Pen and KTL, Key Trading Levels indicators. Download them, install them, enjoy them. They are there for you. So we got the daily bullish divergence at the end of this move. Lower lows on the chart, higher lows on the indicator, on the moving average of the MACD, on the RSI, as well as the histogram flipping from negative to positive to negative zone. Same happens on the next following chart, 4-hour bullish divergence on the moving average and RSI. All the rest is history, right? And the 1-hour chart, the next one in the sequence. And note the daily level also build up here. It's important. And on the 1-hour chart, here we are. We've got absolutely the same lower lows on the chart, higher lows on the MACD moving average, creating a bullish divergence, false breakout, making fake low, and the flip of the price. Okay, from a sequence of lower highs, lower lows, we finally flip. To the higher low. So this is the analysis behind it. This is why I choose to look for buys. Now, there are millions of possible ways how you can enter a trade, and I want in this video to explain the Fibonacci, uh, help it could, it could give you. So I plot Fibonacci on the ongoing trending structure. By that being said, Okay, you have to understand how to plot the Fibonacci. So this is the Fibonacci, the retracement. First of all, on, on different trading platforms, it could be different, um, the tools or the different buttons. Okay, so starting point of the movement to the ending point of the movement. By that, you have to understand you want to measure on trending conditions. Trending conditions That's where you have sequence of highs and lows in the same direction. Many traders, what they do is they take Fibonacci randomly from some spike here or here or here, and they say, oh, there is a move, that is Fibonacci. No, there isn't. Okay, Fibonacci is a classical tool if used properly, and properly it's not attached to random moves. Because the idea of the Fibonacci is to measure the retracement levels or expansion levels, etc., in a given movement. The given movement should not be random. The given movement should represent a wave of buyers or sellers, and then you can plot the Fibonacci to find mathematical levels. Makes sense. For me, it is represented by sequence of highs and lows. Now, as the trend started going here, you can see higher highs, higher lows. I don't know at that point if there will be retrace or not. So the Fibonacci, if the move continues, right, if the move continues up, I can just go and adjust the Fibonacci. Okay, so As the trend develops, the Fibonacci of course is developing as well. When it is stable is once the price starts to pull back. Reasonable pullbacks of Fibonacci, and there are some arguments about that, some say that the deeper it pulls back the better, some say the less it pulls back the better, this argument is endless. The reasonable acceptable Pullback is toward the zone of 38 to 61.8 Fibonacci. Now here comes the next question: how to trade it? Some traders love to deal with— as the price pulls back, they are checking for a reaction, right? The next bullish candle, and they are in. Some people prefer to wait for setups like range breakout. Like myself, or ABCD lines, right? Like this ABCD and breakout, like myself. Some others love to use pending orders, and that's what I want to discuss about. When can you work with pending orders? When you have everything synchronized among the multi-timeframe analysis you did without signs against you, then. Your chances to ride after a pullback because you don't want to fall in a correction. And you know the difference. Pullback is not a correction. Correction is not a pullback. Correction, it's an anti-trending move. If you had trending move, you expect correction once there are signs against you. Correction could be range or ABCD. You don't want to fall in this trap. Okay. Pullback is when you are in ongoing trending structure without signs against you, like in this case. We have this higher highs, higher lows. We don't have any signs that it's over. No, no divergences on none of the charts. Technically, it's just the beginning. Okay, once you found this condition, you can use pullback up to where? 38.50, 61.8? The answer is wherever you will get a good reasonable risk reward. So based on your analysis, for me, for example, I was looking for the first target zone to be around the next key highs. Okay. And the daily, as you can see, daily and 4-hour chart volume. Okay. Once again, I want to remind you, these very amazing indicators, the Virtual Trading Pen and the volume key trading levels based on the volume indicator, available for you for free below this video in the description. You can find the link to them. Download, install, enjoy. So, uh, wherever you get a good risk-reward— because you cannot— not you, not me, nobody can predict how deep a correction or a pullback would be, okay? It's something you can do only looking backwards. In real time, it's impossible. If 38.2 gives you a good risk-reward, go with it. If 50 gives you The— when I say good, of course it makes sense if it— if 38 gives you good risk reward, then 50 will give you even better. The thing is, the more you ask from the market, the less the probability you will get it. Makes sense? Uh, so you need to understand that you cannot be greedy here, and that's why at the moment you get a reasonable good risk reward in your favor, positive risk reward, go with that. Personally I love the 38 to 50. Okay, now besides that, what I love to, to work with is the lows of the downtrend. So if this is my ongoing downtrend, uh, uptrend, this is my current low. I love the Fibonacci that fits this level, in that case 50. As you can see, that's where you can use your Pending orders, the lows of the uptrend that developing. In that case, uptrend. Of course, it could be vice versa for the downtrend. Okay, and the Fibonacci wherever it fits. That's what I love to use. Another important thing, of course, you can start paying attention to candle patterns like engulfings and more, or you can wait for setups. As I said, correction could be a range or ABCD correction. And once it breaks, that's your chance to hop in. Another last tip is when your Fibonacci levels match with this amazing volume zone— and you can find in my channel a volume profile video how to use this, okay— when that matches together, download this indicator because it could help you in your trading With anything you do, when when it matches and holds, it increases your probabilities dramatically. What levels you would want to protect in ongoing trending structures? What you will want to protect? It's basically the next lows. So the first lows are where you want to attack. You want to protect the lows, right? The lows. That for me are below Fibonacci. So 61.8, I check which low was below the Fibonacci, which is here. This is where I will want to protect, and this is exactly what you see here, okay, on my trading opportunity. That's it. That's what I want to do. That's what I love to do. That's what I wanted to share with you. Straightforward technique, very, very, very, very logical. With few key elements to pay attention to: multi-timeframe analysis, key trading levels, trending structures lined up, volume of course comes to the help, right? And use the Fibonacci properly on trending structures. Don't draw Fibonacci on random moves, uh, it's, it's mistake. It's simply a mistake, okay? It's like taking a drill and drilling backwards, okay? Reverse. So just use every single tool the way it's supposed to be used. That you want to find Fibonacci retraced levels on given trending conditions. Waves. Waves are built, right? Every trend is built by waves, okay? So you want to take these waves and you want to find find the ratios in between these waves, because these ratios give you reasonable Fibonacci levels. And these Fibonacci levels would not be just numbers out of nowhere. They will be there next to the important swing highs and lows you will need to use in order to use pending orders and protections. So use it wisely, and I hope you enjoy that. So if you find this video useful and helpful Please show your support back, hit this like button below this video. If you have any questions, uh, let me know in the comment section below the video. I'll be more than happy to answer and to assist. And thank you for your time watching this video. Once again, I would like to welcome you to our trading family, Traders Academy Club, where you will enjoy from our free full VIP price action course our real-time trading ideas, our real-time trading education, mainly our trading community. Join our family with the link below this video in the description. I wish you and yours all the best. Thanks for your time. I'll see you soon with more. Bye for now.