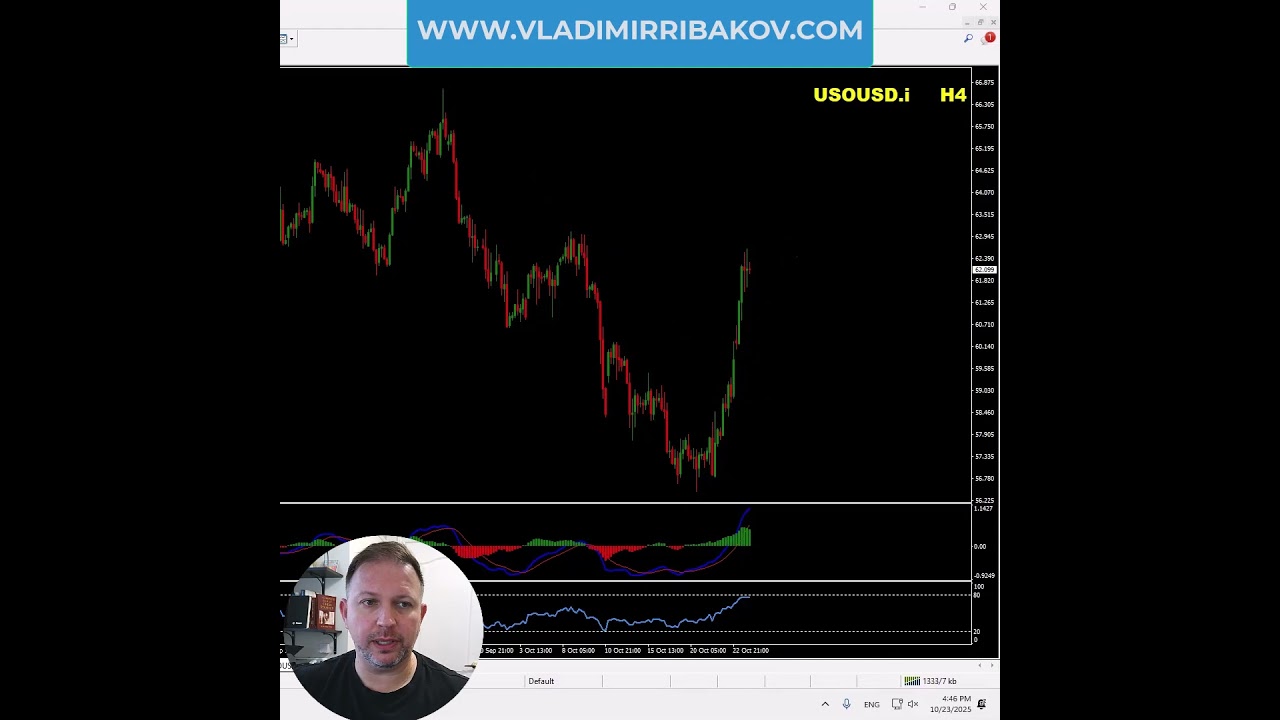
Vladimir Ribakov analyzes WTI crude oil's bullish setup following Trump sanctions on Russia. The 4-hour chart shows a bullish MACD divergence and broken upward trendline, while the 1-hour displays higher highs and lows. Key support zones sit at $61.85-$61.50 and $60.80-$61.20 before the next leg up.
Chapters
What's up guys, Vladimir here from Home Trader Club. After Trump's sanction on Russia, the oil is under a bullish run. So what do we have on the charts? By the way, you can read the full article right here in our blog vladimirribakov.com. On the 4-hour chart, at the end of the 3 waves to the downside, we have a bullish divergence on the MACD. Lower lows on the chart, higher lows on the MACD. The most recent trend line is broken to the upside under a huge bullish momentum. On the 1-hour chart, we get a sequence of higher highs, higher lows, and here are some key levels for bullish continuation. Weekly broken resistance based on the pivot down to the previous week pivot, which is around $61.85 down to $61.50. Then we have this range before the buyers took control around the daily resistance 1 pivot. This is around 60.80 up to 61.20. And the lowest zone, weekly resistance 1 with the previous day pivot and of course the broken resistance that now becomes support, 60 down to 59.20. Retraces to these levels and I believe the oil has more buyers coming.