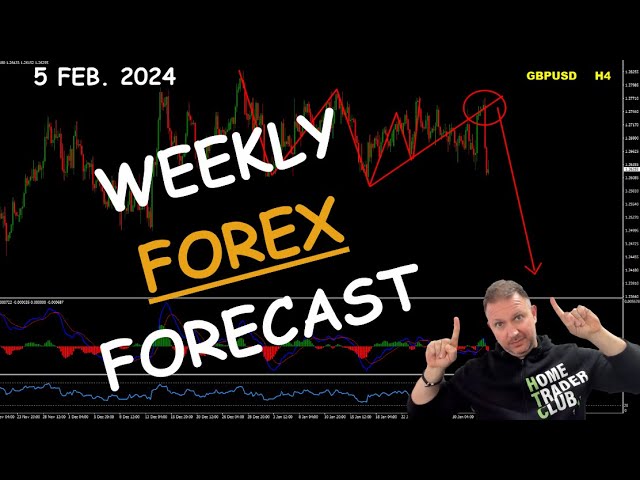
Vladimir Ribakov analyzes EUR/USD, GBP/USD, and AUD/CHF. EUR/USD shows a bearish divergence and ABCD pattern pointing to a daily demand area. GBP/USD has a zig-zag corrective structure with Fibonacci levels to watch. AUD/CHF is bearish but could reverse if a weekly divergence confirms.
Chapters
Hello traders, how are you? Vladimir here from Home Trader Club. Welcome to the weekly Forex forecast. In today's video, 3 absolutely phenomenal trading pairs and the moves they delivered during this week and what very possibly To come after this week, following this week, should bring very good opportunities. So that would be the euro dollar, pound dollar, and the Aussie franc. Let's begin. Before we start, big thanks and thumbs up to Eightka Broker for supporting me and this channel to enjoy all the offers we have thanks to Eightka Broker, especially for the community, including the access to the trading systems. Up to 1 year access to Home Trader Club and all of the trading courses and the real-time trading opportunities and the community and to private mentoring sessions, follow the link below this video in the description. So the first pair I want to start with is the EURUSD. Following the analysis we had on one of the recent videos I published in the channel We were talking about the break of this range and with anticipation to reach at least the previous demand area from the daily chart with big possibility and probability it will go even beyond this area. So the pair really gains the momentum and continues. I cannot say it was moving clearly because it's not. It's making a lot of noise, a lot of fake highs. But every time it tries, it fails, which proves again the control of the sellers. So what and why and how does that look like and connect to the higher time frame? So as we discussed on one of the recent weekly sessions, the fact it ended with a bearish divergence teaches us that the euro-dollar is very possibly under ABCD correction. Which means we should complete the second leg or at least some sort of a range which afterwards can flip and make the rally. Okay, with that in mind, going to the daily chart, the last conditions we have here in terms of divergence was bearish divergence. While the market was making the higher highs, the indicator was making lower highs. Bearish divergence preparing for a sell. And the interesting part during all this period, take a look on this balance zone based on the Volume Profile indicator. It's holding here stiff. So the most recent rising supportive line was broken and now the pair is approaching the next one if you connect the first 2 lows. Now the interesting part here is we also have this Pretty significant, I would say, demand area. And of course, we have the low of interest before. So I believe the euro dollar is making its way to this area, which will also be next to the supportive line. So we should see the euro pushing down to here. If it simply goes beyond this level without making any conditions of a reversal. Then that would be a call for further move down and then to complete— remember we discussed about the weekly ABCD or 2 waves correction— then it will be to complete this big move down. On the shorter term, the way it looks on the 4-hour chart, again, the demand here could provide some stoppage and some pullbacks. But the general direction was and remains bearish. We have now establishing here following the resistance line. So as long as these highs, first and second, basically hold, the pressure of the euro dollar remains bearish with anticipation to reach the at least the demand area of the daily chart. And if it breaks below that, it opens the door for further move down. To the weekly potential low, and that's very big move down. So my view was and remains bearish as long as the recent swing highs hold. For me, the bearish view is on. What do you think about the EUR/USD? Let me know in the comment section below this video. I would be actually very interested to hear how do you see this one. And the next pair, the pound-dollar. In the last video I published for you, we were talking about 2 scenarios: one, break and hold below this low; 2, break above the range for continuation. So as you can see, scenario one happened right by Friday. This volume profile balance zone managed to hold and hold pretty strongly. And more interesting part here That after the initial zigzag structure with this ABCD we saw from the pound dollar and the break below this area, now we restarted with an absolutely interesting to me structure. If that holds, that means the next leg should bring a lot of the bearish momentum. Now. Exactly like the euro-dollar we discussed before, the pound-dollar is very likely to complete a zigzag structure— 2 waves up, 2 waves down— before the continuation, or at least some sort of a range, which makes me think that we are now under a bearish corrective zone. Going with that to the lower time frame to try and to time the situation So as I said, I believe if my analysis is correct, then that the bearish momentum is currently on as long as this key zone holds. If it doesn't, and if we see it, if it was a fake break to the downside, if it just goes up, then the GBPUSD opens the door for significant rally towards 134, 135. But as long as that holds, let's go with this assumption. I believe we are under bearish pressure and sell the rallies here should be the plan according to the weekly and with the, with the waves on the 4-hour chart and with the fact that the daily chart completed its 3-wave here. Okay, so with the anticipation of that to deliver the corrective structure I would be aiming towards the previous low from the daily chart together with the broken resistance that become a support, which also fit in 38% and 50% Fibonacci. This would be the initial target zone. And exactly as with the EUR/USD, if it breaks below, then it opens the door for bigger move down, bigger correction as ABCD from the weekly chart. And if I go back to the 4-hour chart, I want to show you with the breakout. If this breakout is, um, is good, then take a look what happens here. Very important thing I want— I'm zooming out to show you on purpose how it all fits. Okay, so this is the breakout zone we discussed about, the 38 down to 50% Fibonacci, right? Now take a look. Let's go zoom in again. Take a look on the Bollinger Bands. What I did is I'm using here my indicator of the Bollinger Band. Take a look here on the situation. This is the most recent breakout, clear breakout. Okay, again, if the analysis is correct and the bears take the control, that look where the first duplication of the resist or of the support area would be. Okay, right there, right between the Fibonacci as we discussed. So that really opens up here as a great Potential target zone for the pound dollar as the first target zone. So Bollinger Bands, the waves, the divergences all lined up, and yet with with the last clearly crazy zigzags that we experienced on the on this pair in general in the market. on the last couple of weeks or more actually. It's very tricky and everything could happen here. The speculation and manipulation around the Federal Reserve rates coming for March, that's really important to remember that value your risk properly and Do your trading very, very responsibly. And the final pair for today, the Aussie franc. Before we move on, I would like to ask your support. If you find value and appreciate this video and the work I upload here for you, please hit this like button. And if you are new to our community, please consider to subscribe with the subscribe button below this video. Your help is very much appreciated. Thank you very much in advance for taking the time. And supporting this channel. So the Aussie franc is clearly on a bearish trend, okay? There is no doubt about how it all looks like. You can clearly see how it develops itself. It's simply continuing and continuing and continuing. But with that in mind, we are now in these spikes. That's where the buyers really resisted the last time, and we are very close to the low, and we are inside this huge buy zone. I believe that the weekly chart here at this area— let me draw it for you cleaner— would or should form a bullish divergence and eventually make a big turnaround, at least to this high, very possibly even beyond. However, at the moment, as long as it is forming, I believe The buyers are still not in the game, and at least for the short term, sell the rallies as long as this zone holds, right? And as long as the broken support that now is a resistance holds, as long as this area holds, sell the rallies is the plan for me until the weekly divergence would actually complete itself. And if we go to the 4-hour chart, the waves At the moment lined up perfectly. We have the three lower highs, lower lows. There is nothing against us, which means for me again sell the rallies until there will be signs against starting from the four hour, then the daily and the weekly chart. Bearish direction it was, bearish direction it remains, and as long as this first zone hold, for me. Sell the rallies should be the clear trading plan here. So that's it for this video. Thank you very much for watching once again. If you enjoy this video and you find value, please don't forget to like, uh, this video and also feel free to share it with anyone who you believe can benefit watching that. I also would like to invite you to our trading family, the Home Trader Club, to enjoy all of our trading courses, real-time trading opportunities, access to the community, and so, so, so much more. Join our family with the link below this video in the description. Best to you and yours. See you soon with more. Bye for now and good trading.