Forex Weekly Forecast - GBPUSD, EURUSD, EURGBP, USDJPY - 29 April 2024 - By Vladimir Ribakov
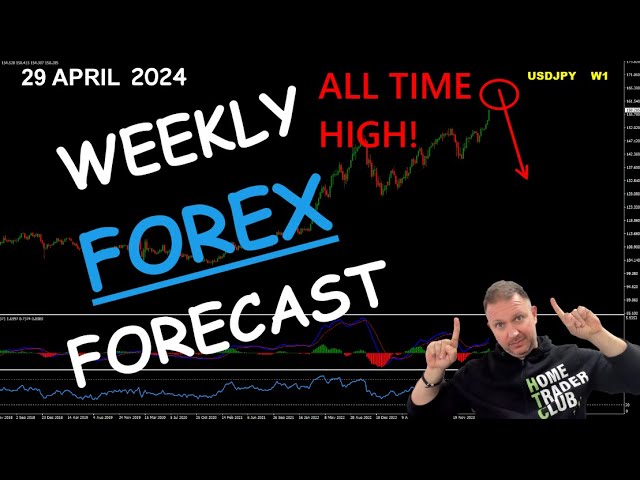
In this weekly forecast video, Vladimir Ribakov of Home Trader Club delivers a detailed technical analysis and trade plan for four major forex pairs – EUR/USD, GBP/USD, EUR/GBP, and USD/JPY. For each pair he outlines two possible market scenarios (ABCD correction vs. range‑bound bounce), evaluates price action across weekly, daily, 4‑hour and 1‑hour charts, and identifies key support/resistance zones, Fibonacci extensions, Bollinger‑band behavior, RSI/MACD divergences, and volume‑profile clusters. His overarching bias remains bearish, favouring "sell‑the‑rallies" strategies while cautioning against premature entries when price structures are ambiguous. He also stresses risk‑management rules, the importance of waiting for clear structural confirmation, and the need to adapt plans if scenarios diverge. The video concludes with calls to action for the Home Trader Club community, promotion of 8K Broker offers, free e‑books, and subscription invitations.
Chapters
Hello traders, how are you? Vladimir here from Home Trader Club. Welcome to the weekly forex forecast. Before we begin, big thanks to 8K Broker for supporting my community and this channel. To enjoy all the special offers we have together with 8K Broker, Including the access to up to one year to Home Trader Club, my trading systems, and our day trading or short-term trading live trading room. Please follow the link below this video in the description. The first pair I would like to start this week with would be the euro dollar. This is a pair we are following for a long time now, and if you follow the weekly forecast. You probably are aware of that. So we started all these from this major sell, and the plan we discussed on the last week was to get an ABCD correction and breakout. And after the breakout, we can look to add on, on the ongoing sell. But I want to go to the roots of the analysis we've had And to remind two scenarios we've had, one of the scenarios we discussed that after these two waves the market possibly will make two waves to the downside, but there is a possibility that it will do a range before another rally or final rally if you want to call it this way. The recent price action. Opens the door for this very possibility, and I want to show how. Don't get confused. My bearish view remains on, but I want to show what could start and changing here. If we are talking about this range, then basically as long as these low holds, we could start and see here some sort of activity like that waves within the range before the market will decide what's next. And the reason I suspect this is a possible scenario is because the first leg is making now a structure of 3 higher highs, higher lows. By itself, this is many times a very suspicious, uh, behavior. And many times, after what starts to look like sellers are back in control after pullbacks they are actually going for final rally before they manage to take further control. And this is a very possible scenario. We have several very important zones on the way. Okay, take a look. First of all, the main zone— low, low, low, low— all that creates a major demand area where buyers actually resisted, rejected To the sellers, and the recent one which currently holds is here. So as long as these zones hold, I would not be surprised if the euro is trying to make this second move down on the. So this is for the bullish scenario if the levels actually manage to hold and the price reject. However, the bigger possibility is that according to the daily chart. On the current wave, we are still in a structure of lower highs, lower lows, and there are no signs against nowhere. So technically speaking, sell the rallies should remain the plan. In order for that to happen, what we would want to see is this rising correction, or, or you name it as you prefer. Managed to start and make bearish waves. We want to see it breaks down, but not just a break which could turn fake, but we want to see a sequence of lower highs, lower lows. Why? So it gives a sign that the sellers are taking control. When the sellers are taking control, we start to see lower highs, lower lows. That's how defined That's how bearish movement or bearish structure or bearish momentum is defined and developed. Okay, so if we manage to break that down, then sell the rallies would actually remain the plan, following the same logic that the euro can still complete its ABCD before any further move down. Okay, so my priority here was and remains bearish. I am after sells. And if it completes here some sort of ABCD like this with a bearish divergence, then we just adjust the line, right? With the breakout, we are after sells. But on the short term, I would very, very suspiciously treat the current price movement and would not rush into a sell with the— again, with the way that the price action moves right now. So it's a bit of a complex wavings right now between the higher time frame and the medium time frame, the weekly, daily, and the 4-hour chart. So it's very important that these situations to be careful. Take a look, unlike the previous move when we started to get involved in the sell, when actually it was obvious that the market is making lower highs, lower lows, and clean ABCD correction. with major breakout. Right now, this structure contradicts potentially the higher time frame, and that's why it's important to put all the possible scenarios for these outcomes. And for the short term, as long as this level holds, we actually could see the euro trying to make a bounce to the upside. What would be your view on the EUR/USD Do you think we should rally towards the 110 again, maybe even beyond that, or the way down all the way to 105 or even lower than that is structured and sort of guaranteed? Let us know in the comment section below this video. The next pair would be the pound-dollar, but before that, I would like to ask your support and your help. If you find value in this video, if you appreciate the opportunities and the analysis, please Hit this like button. If you are new to our channel, please consider to subscribe so you know when there is a new content available for you— trading strategies, trading opportunities, and so much more in this very channel. Please subscribe with subscribe button below this video, and thanks for taking the time to help. Also, feel free to share this video. It is absolutely open for the community. I also want to remind you that we uploaded a series of new trading ebooks, free ebooks to the blog. So all you have to do is to go to the blog vladimirribakov.com, Forex Education, and from there navigate to Free Ebooks. That's it. You— here you will find on this page our series of new ebooks, and there will be more added, uh, soon. So feel free to download them and enjoy the reading. The next pair is the pound-dollar, but take a look before we go to the charts What is very interesting here? So I'm now in a market strength snapshot. That's one of the features we have in Home Trader Club. Take a look what is happening here with the pound dollar. According to the monthly count, we are still in a negative zone of around one percent. However, the last seven days and twenty four hours are already in a corrective structure of half percent. So one of the scenarios we Spoke, and then we'll see how the numbers connect here. One of the scenarios we spoke the last week is when the market will start to make the lower lows, but the indicator will make higher lows, and from there we are going for the bounce. The pound dollar is basically in this very bounce since the beginning of the week. So remember that I said the higher time frame, higher time frame is still negative. That's the monthly chart. However, the last seven days, which as you can see here, and the last 24 hours, they hint the correction exactly like the euro dollar. It has two scenarios. First is we are going for the ABCD and then the rallies. Second is instead of ABCD, we are going for the range and further rallies. The way that the market is. Trying to behave, I would say, is estimating, valuing the chances for the Federal Reserve to actually still be able to cut the rates this year. The chances are low, the data doesn't support it, but the way that the market behaves, they still believe that there will be very something that will leave the Fed with no choice and cut the rates. Personally, I'm doubtful it will happen, but that's how the market responds. So I am still bearish on this pair for the longer run. For me, sell the rallies is still the plan as long as the range is holding. But on the short term, exactly like the euro dollar, we could play within this range considering this bounce happening. And the reason is very simple. If we do go to the 4-hour chart, on the 4-hour chart we are in a clean movement structure to the downside, then sort of 3 waves to the upside, which makes me think exactly like with the EUR/USD That after the pullback, we still might see some correction upside. So while the longer term doesn't have a clean structure, and what do I mean by clean structure? Take a look how the first leg was: three waves down with ABCD correction. It has no doubts on what a clean price movement is. But right now, after a bullish divergence. And some sequence of higher highs, higher lows, which do not show ABCD but show sort of 3 higher highs, higher lows, it brings me the possibility that the longer term is yet not clean. So for me, I am after short-term sells. How? The broken support that becomes a resistance up to the level where the buyers The seller, sorry, took the control. And the same with the previous area, which is here, where the sellers were in control here, here, and here. Zone 1, zone 2, uh, rallies towards there, and I am after sells. Okay, we also have a falling resistance line. Pardon me. We also have the falling resistance line here, and as long as the— and the dynamic 200 moving average, of course. And as long as it holds, these rallies, from my point of view, should be sold. And on the 1-hour chart, we can start to see the bearish divergence taking place already, which makes me think that if we do have this rally with one more high or one more fake high, they should be opportunity for a sell. And alternatively, exactly like in the case of the EUR/USD, if the pound bounces to the downside first of all, I would not rush to sell here because these demand areas we see on the way could actually go and cause the short-term bounces. For a long term, The ideal scenario for me is going to be bigger ABCD or a range and a sell as long as the weekly range is holding. Okay, so that's pretty much it for the pound-dollar. While the longer term I believe is still building, on the shorter term I am after sell the rallies if they take place or buy these dips if they happen first of all. at the beginning of the week. That's my trading plan for the pound-dollar. What would be yours? Share with us in the comment section below this video. The next pair is the euro-pound, the cross of what we discussed on both, and this one is very interesting because it could open the doors for something big here. According to the weekly chart, At the end of this trending structure, we received a corrective movement which was broken down and retested. Theoretically speaking, we start to see lower highs, lower lows, which is a very big probability that the euro pound should open the doors to the next lows to be retested, and that's a very big probability. Here. For that to happen, I want to see this ranging corrective structure, you name it, on the daily chart— is sort of expanding a channel being broken, making the lower lows and sell the rallies— is going to be the trading plan for this pair. Okay, straightforward to the downside. However, And this, that's very important thing. Exactly like with the euro dollar and the pound dollar we saw, we do have a potential contradicting structure with the 3 higher highs, higher lows in play, which means as long as the demand areas which are right here next to this zone right here, as long as they hold, these bounces On the short term are very possible. And here is what I want you to pay attention to. Okay, take a look on the four-hour chart. Once again, this is our rising supportive lines we have from the daily chart, right? And that's the lows of the demand. We have a huge volume profiles on here as well. Absolutely strong zone. And take a look how it behaves. Straight move on the Bollingers from the upper band through the lower band usually brings up to 50% deviation. So if this is the full x distance, this should be x divided by 2 or 50% of the x, right? And if that takes place Let me just erase that. If that takes place for us, I believe that as it goes here, we should start to see the momentum slowing down and short-term bounces taking place on the euro pound. So that's the also very possible scenario on the shorter term, okay? The slowdown here and As you can see, the waves are developing. Very, very, very possibly we will start to see lower lows in the chart versus higher lows on the indicator, and eventually short-term rallies continue. Okay, this is for the short-term buys. For the long-term sell, as I explained before, what I want to see is the break below this rising correction Right? Retest of the broken area and the volume zone, and from there go with the weekly and the monthly levels heading towards the next important lows on the go. So this is my trading plan on the euro pound. What would be yours? Share with us in the comment section. The final one would be the dollar yen. You see on the screen. EURJPY. It's just for a follow-up from what we discussed on the previous week where the plan was— one of the plans we discussed is if we get another fake high with a divergence completed, then break below the rising supportive line could be our sell. As you can see, the plan never triggered. We did have a high, but it never turned to be a fake high. And the divergence never completed. So I now will go to the dollar yen, and I want to explain this one because I think it is a very interesting flow of events which will force the government and the central bank of Japan to do something like cutting their quantitative easings. And/or do something with the rates much more massively than they did by far. And one of the— another thing I want you to pay attention to, once again back to the market's trend snapshot, take a look on the numbers. The monthly chart is getting close to 3% price exchange. That's in a deviation of abnormal. That's not usual normal average numbers. The bigger these numbers go, the stronger the pressure starts to be on the pair for that correction. And you can see we can see that the lower numbers start to shrink. So what do we have on the dollar yen in terms of the technical view? If we go to the monthly chart and we plot Fibonacci extension right on the ongoing legs. We would figure out, let me just show it to you, that theoretically speaking, okay, in a scary scenario, the dollar-yen could climb towards the 161.8, which is around 180. Okay, if it does, I believe the crash there is going to be massive for like 4,000, 5,000, 6,000 pips. But we also need to remember that all that could be part of a triple cycle, and if so, one, two, and three. If so, we are already in a magnet zone of which means two different Fibonacci extensions. With the potential bearish divergence to form on the monthly chart. I say potential because we don't have that yet completed. It yet has to complete. Okay, we also have a riding on the upper Bollinger Bands for over 20 candles, which by itself brings a major pressure to the sell. Take also into consideration what happened last time in 2015 And you, we all remember the huge massive move down. So the question with the dollar yen, it is approaching to key levels on the monthly. On the weekly chart, it is also under potential divergence here and here. I say potential because once again it is yet to form, it never was completed. Okay, and if you take a look here on the daily chart We are already in overbought conditions on the RSI with this major rally. Last time it happened was, well, close to the overbought was here, and it was leading the major correction. So the rumors and the level of manipulation in Japan is always big. So One of the two scenarios is usually happening on overbought conditions, and please remember, don't try to bet when the peak will happen. This is a mistake so many traders do. They try to say, "Ooh, now it's a peak! Ooh, now it's a peak!" Ooh, and they find themselves building sell, sell, sell, sell, sell while the rally continues massively, and then they wake up one day like, "What to do now with a floating?" Hundreds or thousand pips against them, and it's very important to have a very, very, very clear plan. If something doesn't develop the way it does, cut it out. Accept that. Trust me, I did these mistakes in the past, and I know how painful it could be, especially with the yen. So one of the scenarios that could happen here. We should start to see a fake high building up. Okay, if they do fake high, fake high, we would want to see also lower highs on the MACD. Then it's a green light for further sells. We have the rising supportive line and the lows break below them could eventually open the doors for a major sell. But after V patterns. Many times what starts to happen is that we start to have 2 waves down, 2 waves up, and then a ranging breakout or ABCD breakout for further continuation. So not always it goes and creates classical fake highs and trendline breakout, not always. And that's why I want to show you the alternative. And the alternative is that after the major rally that place right now. We started to see the lower highs, lower lows, attempt to make another rally which actually ends with the breakout and leads to the sell. So is it good to buy here? I personally don't go and try to chase ongoing trend. Uh, usually such rallies are manipulative. Usually they end up Brutally. I don't know when it's gonna happen. I don't know if it will happen. But what I do know that I do have specific levels where I am looking to get my action ready, which I showed you before with the Fibonacci. I do know how I want the price to structure itself, and if it does, I trade it. Okay, so I basically trade my— I plan my trade and I trade my plan afterwards. And that's the best advice I can do to you, give to you. Uh, do not rush to take a sell or to call it a peak, because believe me, I saw way too many times everyone saying, hey, it's now, it will be good, now it will be good, and just shooting out in a— just hoping for good. And if you don't do it properly based on specific strategy rules It could be not so good, not so sweet. So be very careful with that. Okay, so dollar yen is approaching to these key levels. I don't know if it's gonna happen this week because the coming period we will see the non-farm payroll also, uh, but the way it looks and the levels it is approaching say that the coming weeks are going to be critical. And I wanted to build this fundamental, uh, build this, um, preparation plan so you know what to follow and you know where and how to act with a high probability that when the reversal will take place and the setup forms, you will have the risk-reward on your side. So that's it for this video. I hope you find value in this one. If you did, please don't forget to hit the like button And to subscribe to our channel if you are new to this channel with the subscribe button below this video. I want to invite you to our trading family, the Home Trader Club. Get your access to all of our comprehensive trading courses, media zone, access to our real-time trading education, real-time trading opportunities, live sessions on Mondays, access to the community. and so much more. Join our family with the link below this video in the description. Meanwhile, thanks for watching. Best to you and yours. Good trading. I'll see you soon with more. Bye for now.
More from Vladimir






Stop Buying USDJPY: The Critical Resistance You Need To See #forex #tradingstrategy #shorts




