Forex Weekly Forecast - GBPUSD, EURUSD, EURJPY, USDCAD - 22 April 2024 - By Vladimir Ribakov
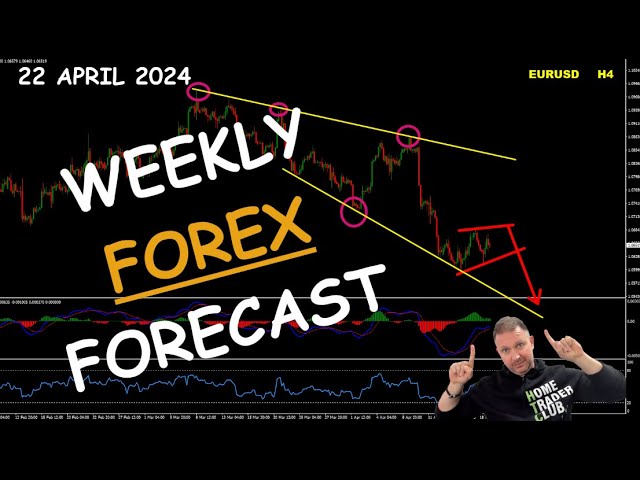
Vladimir Ribakov analyzes four currency pairs for the week ahead. GBP/USD may offer short-term buys after pullback despite bearish bias. EUR/JPY is set up to sell rallies with potential sharp downside from a supply zone. USD/CAD favors buying dips in a higher-high, higher-low structure.
Chapters
Hey guys, how are you? Vladimir here from Home Trader Club. Welcome to the weekly forex forecast. Before we start, big thanks to 8K Broker for supporting me, my community, and this channel. To enjoy all the special offers we have with 8K Brokers, Including the access up to one year to Home Trader Club, to our educational club, the real-time trading opportunities, real-time trading education, including the trading systems, the SRS, BBB, private mentoring sessions, and including to our day trading, short-term trading, live trading room. Please follow the link below this video in the description where you can find all. The information and all the amazing offers we have together with Etka Broker. The first pair I would like to start with today, this week, would be the pound-dollar. So this is a follow-up to our plan that we've had, as you can see on this very image, we were following in the last several weeks, we were talking about that and you can find it on the previous videos. Of course, as always, one of the scenarios was this pullback and the continuation down. The lines you can see here, that's one of the triggers we got here in Home Trader Club. That's directly from the members area, as you can see here. Now, the reason you see these lines here is because we reached the target and not— that's not what the point of these lines. I want to show you why these lines are critical and where it could go from here, and where on a shorter term I do believe the pound-dollar will start to create buy opportunities. So in order to understand, let's go to long screen here, would be simpler to explain. So in order to understand the logic of this, uh, sell, we need to understand the longer-term buys. The way I see the pound-dollar, it is building 2 waves to the upside, 2 waves to the downside, which should complete the weekly ABCD or a range. And with that idea in mind The sell we did before. So again, it's either the ABCD or a range. If it's a range, it should be forming a bottom sometimes, sometime somewhere soon. If it's completing the ABCD, then there is a very big probability we will see the pound dollar reaching down. To— let me just put the lines here— Fibonacci extension down to 100% Fibonacci. And this— whoa, that's an ugly line— and this beautiful clearance zone, or the demand area where previous buyers showed interest from. Once that completes, again, either the ABCD to the 61.8 and a range, or As this has it for the ABCD to the 100%, from there for the long term I expect further buy continuation. If we take it down to the daily chart, here are several zones we need to pay attention to. First of all, if we connect the first two lows of this uptrend, we will see that the pound dollar has a significant rising supportive line that goes through these lows. Besides that, we have a strong demand area where the buyers were in control here and here before. So there is a very serious chance that the pound-dollar, with all the momentum, will try— maybe after some pullbacks, yeah— will try to reach this very area where we should see the RSI and MACD Making some sort of oversold conditions on the short term. From there, I do believe that here the pound dollar is going to provide short-term buy opportunities and then further sell to complete the weekly ABCD or the range we discussed before. Of course, just That's the lines should be a little bit more. Okay, here we go. Okay, so this is how I see the pound dollar. And if we go back to our four-hour chart, so once again we are ongoing with the momentum. But pay attention that this is a potential developing bullish divergence, which means very very likely the pound dollar is going to. Start form the lows here, lower lows on the chart versus higher lows on the indicator, and then provide the buy opportunities. So I am still bearish on the pound-dollar. However, we are approaching to key levels where on the short term I believe there will be buys. What are your thoughts about pound-dollar? Share with us how do you see this one in the comment section. Below this video. The next one for today, euro dollar. Before that, I would like to take the opportunity and to ask your support back. If you find value in this video, please don't forget to hit this like button, and few words in the comment section would be a great help and support with all this YouTube algorithm. You know how it works. So if you do appreciate this video and the trading opportunities. And the knowledge I am trying to share with you here in these videos, please support back with the like button. Feel free to share this video, by the way, with anyone who you believe can also find value in it, in watching this video. And thanks again for taking your time. Also, if you are new to our channel, please consider to subscribe with the subscribe button below this video. Again, thanks for your time and for your support. It's very much appreciated. Of course, let's continue. So euro dollar is the next one. Also, I want to remind you where it all started from. This was our bearish idea we discussed a few weeks ago. Started to follow the bearish view on one of our recent videos, and the idea was that the euro will start to create after pullbacks further. continuation down until, like the pound-dollar, it will form some bullish divergence. So while the market is making the lower lows, indicator will start to make higher lows. Now, as with the pound-dollar, same with the euro. I want to remind you the whole idea here. We are expecting the euro to complete the ABCD correction or the range exactly like on the case of the pound-dollar. Dollar before any further direction would be completed. But at the moment, the euro is maintaining its bearish momentum and sort of a movement in a bearish channel. The interesting thing here that we do not have any reversal signs. We have lower lows on the chart with a full synchronization with the indicators Which usually means that the bearish trend is still here and sell the rallies is still the plan. And that's pretty much where we stand with the euro. I believe that the current scenario on the short term is going to complete ABCD before further move down or some sort of a range movement here and then further move down. I do expect the daily and the 4-hour chart exactly like with the pound dollar, by the way, right? To complete that, start making some divergence while the market is making the lower lows indicator to complete higher lows. From there, on the short term, looking for the buys. Meanwhile, the bearish pressure is on for me. The euro dollar is a Sell. How do you expect the euro to continue from here on the coming week or weeks? Let us know in the comment section below this video. The next one for today, the euro yen. As we were following the last week, our plan here was sell the rallies with expectations of further continuation down. But before I continue with the analysis, I would like to let you know. That we started to create a new series of ebooks that you can download and enjoy with absolutely great content. All you have to do is go to the blog, vladimirribakov.com, go here to Forex Education, and this place, Free Ebooks. And you will just scroll down and you will see two of our new ebooks. There will be more would be shared with you right here. Feel free to download them and to enjoy the reading. I hope you find value in watching them, in reading them. So the euro yen, as we wanted to see from the last week, was to sell the rallies. As you can see, after the attempts, several attempts, the euro tried to do. During the week, uh, there was no significant momentum. So the bearish expectations, uh, or the bearish anticipation failed to deliver yet. However, the euro yen is still under key divergence zone and key, up from my point of view, absolutely strong level on the monthly chart. We are coming to the significant massive supply area which did create a major crash around 2007-2008. So what happened here is pretty much similar to what happened back then. We are riding on the upper Bollinger Band for over then 20 candles. The last time it happened was here. As you can see here, this is custom indicator of mine, the Bollinger Band. And I believe that in this zone, with all the conditions that the euro is building, there should be a strong momentum to the downside and clear trend change. The question is timing. On the weekly chart, we already have the bearish divergence that is developing between the higher highs on the chart versus lower highs on the MACD. And RSI is building up as well, and that looks phenomenal. The question is once again the timing, right? So there are 2 scenarios here. While the weekly is making that, the daily could complete one more fake high, complete the divergence as well, and from there make a major move down. The break below the rising supportive line could be a great Trigger if and when that happens for the sell the rallies. But there is also a chance that the euro yen will provide a four-hour chart opportunity. As for now, the euro yen is creating zigzag two waves down and potentially two waves up. If we complete the break below this zigzag ABCD and to make new low. Sell the rallies here would be a wonderful technical opportunity that I will be following. This is option number one. Option number two is that the euro yen is going to complete the daily divergence with the four-hour chart to complete its own sequence of higher highs, higher lows. The last daily leg with that trending structure on the four-hour chart. From there, make the bearish divergence and basically the same logic, the break below the rising supportive line and the low that should be created and then sell the rallies. I'll make it simple with all the levels that are approaching on the monthly chart, the bearish divergence that is forming on the weekly, daily, and the way that the structure, it structures itself with the price on the 4-hour chart. I'm not going to buy even on the price of a miss. In my understanding of trading, it's better to miss than to regret. So even if the buyers will still try to make the final push, let it be. I prefer to catch it when the sales opportunity show and happen. What would you expect from the EUR/JPY? Share with us your insights In the comment section. The final one for today would be the dollar Canadian. The expectations in Canada that somewhere during the summer, very possibly, Canada will start to cut the rates. Will that happen or not? There are too many factors with that, but that's pretty much the expectations at the moment. In the US, it's the opposite. There, where the expectations were for few cuts during 2024, it changed. It changed during the last couple of months to potentially none of the cuts. And moreover, the recent fear in the market is the Fed will have no choice but to hike the rate to keep dealing with the inflation. Their target is 2%. But it doesn't go below three for a while, and actually holding on the upper side. So that's that puts a serious, significant fundamental difference between the two. Technically speaking, I believe that the dollar CAD should complete its final rally and the cycle here on the weekly chart, and the way that the daily forms. Is pretty much— here you go— pretty much similar. It is building the sequence of higher highs, higher lows. At the moment, there are no signs against higher highs on the chart, higher highs on the indicator, RSI as well, nothing here against. So for me, buy these dips is the trading plan. And the way it looks At the moment starts to look pretty much classical. We've had over than 20 candles right on the upper Bollinger Band. With the bearish divergence completed, we expect to see corrective structure, which is ABCD, and look for the buys. Here are a couple of key levels. So first of all, of course, the recent demand area. Then this consolidation area where the buyers and sellers were In short-term fight where the buyers actually took the control, so they might actually go and protect this zone. And the final key zone is this, which was a sequence of resistances here in a row. And as long as that area holds, for me that is buy these dips with the expectations from dollar CAD to actually go. And complete another high. How do you see the dollar CAD? What would be your expectations? Share with us in the comment section below this video. So that's pretty much it for this one. I hope you find value in that, and please don't forget to hit this like button and to subscribe with the subscribe button below this video. There you see the subscribe button. I appreciate your time. Thank you for watching. I hope you appreciate the opportunities and you enjoy them as well. And I wish you and yours all the very best and good successful trading ahead. And I want to invite you to our club, the Home Trader Club, our trading family where you get your access to our complete trading courses, real-time education and real-time trading opportunities shared with you in our live sessions, also in our chat and so much more. Join our family with the link below this video in the description or free with the 8 top broker offers. Also, you can find the link and all the information you need in the link below in the description. So once again, thanks for your time. Best to you and yours and see you soon with more. Good trading. Bye for now.
More from Vladimir






Stop Buying USDJPY: The Critical Resistance You Need To See #forex #tradingstrategy #shorts




