Forex Weekly Forecast - GBPUSD, EURUSD, GOLD XAUUSD - 25 March 2024 - By Vladimir Ribakov
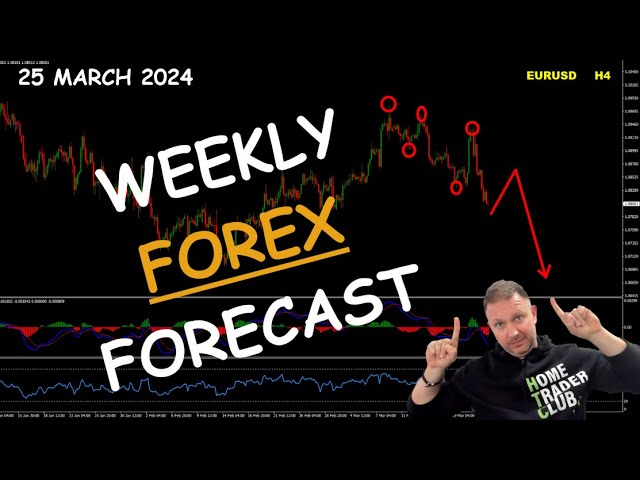
Vladimir Ribakov analyzes GBP/USD, EUR/USD, and Gold using technical analysis. He sees bearish divergence in both currency pairs and recommends shorts, with GBP/USD targeting the 50-61.8% Fibonacci zone. Gold hit an all-time high but shows overbought conditions, signaling a potential short-term pullback.
Chapters
Hello traders, how are you? Vladimir here from Home Trader Club and welcome to the weekly forex forecast. In today's video, pound-dollar, euro-dollar, and gold— all of them are very, very interesting trading opportunities, so let's pay attention. Again, before we start, big thanks to 8K Broker for supporting this community and my channel. To enjoy all the special offers we have with 8K Brokers, including the access to all the trading systems, the trading tools directly from the marketplace, access up to 1 year to Home Trader Club and private mentoring sessions, go to the link below this video in the description and you will find there all of the information and the offers. So the first pair I want to start with will be the pound-dollar. In the last weekly forecast, one of the scenarios we covered was the break below this trend line, which should lead for further bearish continuation. So I want quickly to review the analysis we, we've had, and let's bring back the expectations from this one. So a lot of things changed here, uh, after the Federal Reserve hold the rates and hit and says clearly yes. Many people are believing still that we will start cutting the rates in June. However, they will need more numbers, more information, and currently the numbers do not look promising that the Fed will actually be able to do massive cuts this year as so many investors anticipated, hoped for, who knows. So with that being said, according to the long-term analysis, my personal view is that the pound-dollar should continue its massive rally. However, on the shorter view, after the bounce we've had here with the extreme low we experienced during 2022, The bounce upside happened to be in 2 waves, so most of the times it is followed by 2 waves pullback or a range before any further continuation. And this idea becomes relevant again as we start to see the weekly chart making a bearish divergence here, and the daily chart completed its bearish divergence. Here with the market making higher highs but the indicator making lower highs, and that brings that bearish pressure with a big possibility that the pound-dollar is going lower. So how low could all that go? First of all, if we plot the triple cycle here on the, the 3 waves we have here on the daily chart, we could see the pound-dollar retesting the 50% Fibonacci, maybe 61.8, that would be a possibility that we will still hold inside the range before future breakout to the upside. However, if the price simply goes below these areas, then we should be seeing GBP/USD completing the 2 weekly legs and the daily waves to the downside. So with this bearish view in mind, we go to the 4-hour chart, and again, the As we discussed in the last week, one of the scenarios is the break of this rising supportive line and the lower lows on the chart, which completed the structure. The pound-dollar is currently making the structure of new lower highs, lower lows. There is nothing against us on the on any time frame. Therefore, the plan here is sell. The rallies targeting the same zone as we discussed before based on the daily Fibonacci and then the potential ABCD on the weekly chart to form. I am bearish on the GBP/USD. Well, especially now after the Federal Reserve making its statement and especially after the GBP/USD failed To gain the momentum with the break above this ABCD, that becomes a fake breakout, and usually it's a strong technical sign for further bearish continuation. Let me know what do you think about this one. How low will the pound dollar go from here, or was it all just a threat before the rally again towards the 132-135? Share your thought in the comment section below this video. The next pair I want to cover would be the euro dollar, but before that, I would like to ask your support and your help. If you find value in this video, please hit this like button. If you appreciate the trading opportunities, the analysis I share here with you, feel free to share this video, of course, with anyone who you believe can also benefit watching these trading opportunities and benefit watching this video and gain some knowledge. If you are new to our channel, please consider to subscribe with the subscribe button below this video, and a few words in the comment section would be a fantastic help. So thank you very much for all those of you who take the time and to help. Thank you. So what do we have on the euro dollar and why this one is interesting the way it forms right now? So like the pound dollar, the euro dollar completed its rally and also backed with a bearish divergence here. And most of the times, such cases bring further ABCD correction or a range, which both still very, very valid. Now, if we take that to consideration and understanding that we are probably still within this weekly correction, we go to the daily chart. On a daily chart, here is the interesting part that happened. The last divergence the euro dollar had. Was bearish divergence. While the market made the higher highs, MACD made lower highs, and then the price actually made lower lows. After that, the euro bounced back into waves, holding this major supply zone. A lot of sellers in this area. And what happened this week with the euro dollar in this very zone is that the euro dollar broke this rising supportive line retested that and bounced hardly starting from this zone while it is holding this key, as you can see, volume profile-based balance zone. Absolutely strong sign. And the fact I love here that the EUR/USD on the 4-hour chart is making structure of 3 lower highs, lower lows without any signs against, which basically means that the euro dollar is gaining the momentum. So right now it is moving in this sort of a structure, very likely to assume it will find short-term, um, support here, attempt to make some rally. But I believe any rallies here are basically coming to give us the opportunity to join the sell with this momentum. As per the targets, so the EUR/USD, if we are back to the weekly potential range, then the EUR/USD could go and complete daily 2 waves down. And if it goes beyond that, then the whole weekly 2 waves down. So I would be expecting at least like this low To be retested, probably even beyond that, and then we'll see how and what it develops. So for me, the euro dollar is basically bearish. Let me know how do you see this one and share your thoughts in the comment section below this video. The next one would be gold, but before that, I want to show you also we were talking about the pound dollar, we're talking about the euro dollar. Take a look how that looks like in terms of the numbers. Look at the euro dollar, right? With switching, it was a rally on the previous months, and then we are switching all the way to the negative zone. Very strong numbers. The same happening here, as you can see, with the pound dollar. Also, all starts to build up negative from a very positive rally. We are back to negative when these numbers. This is one of the features we have in Home Trader Club. Of course, the markets. Trend snapshot. When these numbers line up with the technical analysis, many times it brings fantastic trading opportunities. So that's what we have on on these two. And now let's continue with the last one for today. That would be the gold. In last week, the analysis we discussed was that we expect after the pullback gold to complete a rally to all-time high, which we can see gold successfully delivered. The question is what's next? And now here is where it comes very tricky at some point, and I would say interesting on the other. So the weekly chart, I want to remind you, still has a potential divergence for the long run. It's It's not yet completed, but it is potential. And so does monthly between these 2 major highs. It's a bit hard to see the monthly chart from the weekly waves, but if you go to the monthly, you would see this potential divergence. I don't know when it will complete, but it is building up. And what happened with the daily chart this week is very interesting. We got the pullback and we got the new all-time high. Just to complete a bounce from extreme overbought conditions for to complete RSI divergence. Such cases usually also I want to show you here on the Bollinger Bands. Okay, take a look what happens after the recent breakout. Okay, two Bollinger Bands. That's by the way the manual or custom Bollinger Bands indicator of mine. You can find all the information about indicators I use with the link below this video in the description. But with this bounce directly off the second duplication and overbought extremes, I believe the gold is due to correction. So as long as we are holding this top, then I would not be surprised if the gold on the short term will start to create short-term sell opportunities. To complete this pullback. Now what could happen here also, after completing some pullback, the gold would finalize a bullish hidden divergence with higher lows on the chart versus lower low, lower lows on the histogram. From there, rally to complete the final divergence, something like that, higher highs on the chart versus lower highs on the indicator. And then we're gonna face multi-timeframe divergence situation With weekly, actually monthly, weekly, and the daily, and then a major sell would very likely build up. Until then, I wouldn't go with anything long-term at the moment, but short-term, as long as this high in place, there is a great chance we're gonna see gold providing short-term sell opportunities here after another all-time high was actually created. What are your thoughts about the gold? Was that a fake high before a pullback? Would we see a correction? Share us your input and your view in the comment section below this video. So that's it for today, guys. I hope you find value in this video and you enjoyed it. As always, if you did, don't forget this like button to help with the YouTube algorithm, uh, and feel free to share this video with anyone again who you think can enjoy also. Watching these opportunities, please subscribe us with the subscribe button below this video in the description if you are new to the channel. And also, I want to invite you to Home Trader Club, our trading family, where you will enjoy your access to all of our trading courses, comprehensive media zone, live sessions, community, live education, and live trading opportunities that we share with you on in our channels and on any other platform we. have in the club. So join our family with the link below this video in the description. Meanwhile, best to you and yours. See you soon with more. Good trading. Bye for now.
More from Vladimir






Stop Buying USDJPY: The Critical Resistance You Need To See #forex #tradingstrategy #shorts




