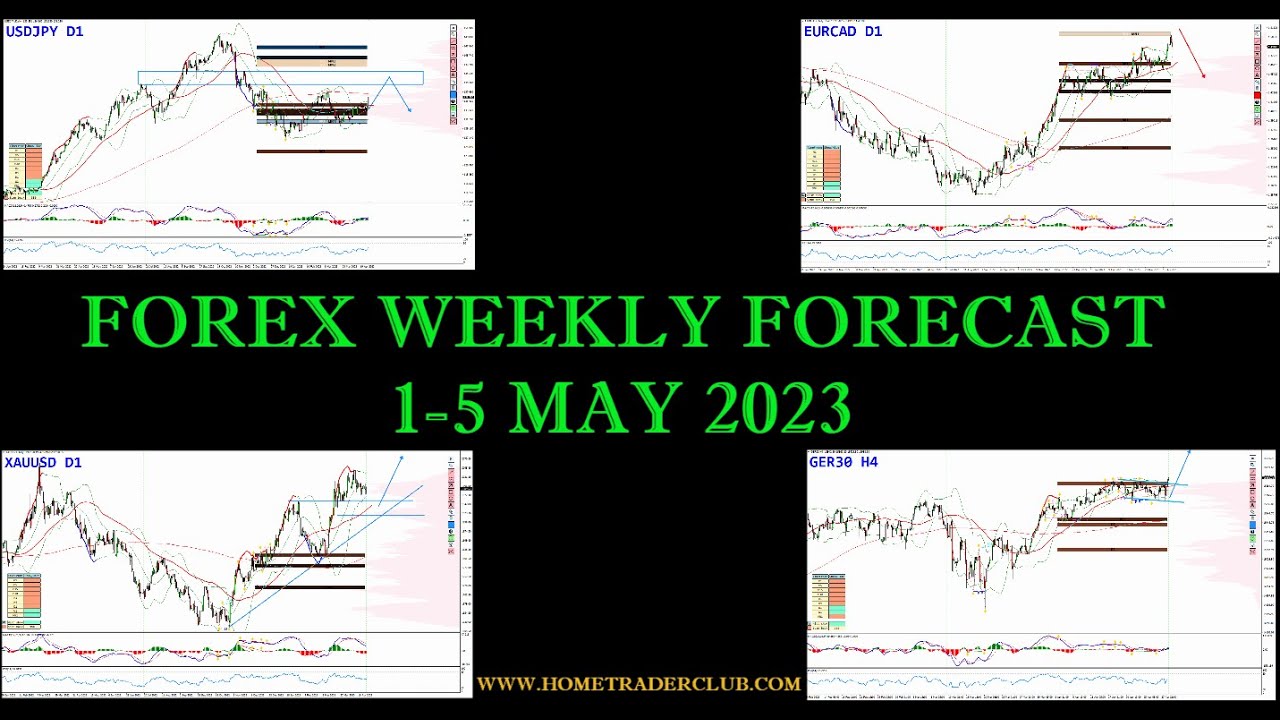
In this weekly video, Vladimir Ribakov of Home Trader Club delivers a market outlook for the first week of May 2023, beginning with a macroeconomic preview that highlights upcoming U.S. data (Federal Reserve funds rate decision, non‑farm payrolls, GDP, and PCE) and the pressure on the banking system. He then provides detailed technical analyses for four tradable assets: USD/JPY, EUR/CAD, gold, and the German DAX. For each instrument he examines longer‑term wave structures, key supply and demand zones, and multi‑timeframe indicators such as MACD, RSI, Bollinger Bands, and divergences, offering specific price targets and trade ideas (e.g., bullish bias on USD/JPY up to a supply zone, short‑term sell‑the‑rally on EUR/CAD near 1.50, gold scenarios for an all‑time high with pull‑back zones, and DAX bullish continuation if range breakout holds). Throughout, he emphasizes the importance of watching for reversal signals (bearish divergences, double tops, candle patterns) and risk management. The video concludes with a call to action for viewers to engage in the comments, like the video, and consider joining the Home Trader Club for further education and real‑time trading opportunities.
Chapters
Hello traders, happy weekend! Vladimir here from Home Trader Club. Welcome to the weekly Forex forecast. Today we are preparing for the first week of May 2023, and with that, I would like to wish you a fantastic and successful month ahead. This week is going to be a very busy week Uh, with, uh, important news. We have the funds rate in the US, we have the non-farm payrolls coming as well. And this is a follow-up to the previous week where we saw that the US economy shrinking with that GDP, uh, showing way below the expected numbers. Uh, and, um, it will be very interesting to see how will the Federal Reserve Act because from one side the economy shrinks, from other side we see that the PCE, very important index for the Federal Reserve in the decisions, shows and teaches us that the economy in terms of retail spending is still there and people are still going and shopping. Oh, this by itself is a big headache for the Fed. Should we go and hike the rates? How aggressive should it be or not? Because we again, the economy shrinks. The banking system is over and over. We see this stories coming out that the banking system is under massive pressure. It's a big headache for the Fed how to jingle with these numbers and how to you know lead this ship. So in this video. We will cover four opportunities this week. That would be let's go to the charts. That would be the dollar yen, the euro CAD, the gold, and the German DAX, which is also very interesting for both shorter and the longer term. I would like to start with the dollar yen, where we saw the during the last week. The Central Bank of Japan publishing, uh, their, uh, statement, the more monetary policy, uh, and the following, of course, statement, then they are not going to shock the market with any new decisions. Um, and we saw the Japanese yen at the beginning, uh, was trying to figure out what's going on, but recently, the last day of the previous week gaining a pretty impressive momentum and taking this rally upside. Now, the interesting part here is, according to Barclays, they would expect for the long run eventually the yen to become again a safe haven currency and the dollar-yen to push down back to 125 and eventually maybe below the 120. Now, I want to show you here how the short term could connect to the long term. And for that, I would like to start with that longer-term analysis. According to the monthly chart, we've had 2 massive waves. The second wave got the dollar-yen towards extreme conditions. We got the MACD creating absolutely new high while the RSI was way overbought. The last time it happened was right here in 2015. We saw how strong this reaction was right before we actually got a new high. But if you take a look how the first move was developing, it basically was moving in some sort of few waves. And right now it does feel that currently we had only one wave, which makes me think that, yep, there is a good chance that with the current ongoing rally, eventually it stops. And we do have another push down in a second wave. With that in mind, I'm going to the weekly chart, and this is the key zone we have in play. We have the previous— the last high on the uptrend before the trend flipped, and the last high, okay, as you can see, uh, before that was created on the move down. So it was right here, okay. And this is the last high that we already managed to create on the first wave pullback. So I believe that this is where the dollar yen will try to complete the current rally before the turnaround. Okay, and going down to the lower time frame, this is how I see the daily chart. So the first move up was broken into The three waves. Then we got a corrective movement, and I think we are right now completing this final wave again. Again, we have these key levels on the on the go. Okay, it's a beautiful supply area slightly above the previous high, and once we get there, I would be paying attention to this scenario when the market will have the higher highs or. Least double top with a bearish divergence and lower highs on the chart. Such conditions will show us that the buyers are leaving the pair behind before the turnaround and the flip. So to summarize up, I am bullish until this zone, or at least until we get the reversal sign and then divergence coming in place— taking place, sorry. And pushing the price down again. So this is my view on the dollar yen. Share your thoughts in the comment section below. If you have any questions, don't hesitate to ask. Of course, the next one on the list is the euro CAD that completes an absolutely massive rally, uh, to the upside. All that happened after we received that massive 3 waves starting from The 2020 was when the pandemic hit us, all the way down to the mid of 2022, and a really massive reaction since. Now the interesting part here is look what happened once the price was riding on the lower Bollinger Band of the week of the weekly chart before the flip. It went all the way to the upper band, completing here a double duplication. So it broke through the Bollinger and completes. 2 of this range, Bollinger Band duplication. With that in mind, we do have here upper, right? So the price rides on the upper Bollinger Band without significant pullback yet, reaching a massive, as you can see here, uh, supply area, psychological 150. And from there we start to see a bearish divergence coming in play. So from my point of view, this becomes a strong rejection zone, and any pullbacks or attempt to rally here should be considered as a potential flip to the downside. Taking it to the daily chart, we can clearly see that at the end of these waves, uh, we experienced here, the market completes a massive bearish divergence. So while the market is making higher highs The indicator that is the MACD as well as the RSI complete a fantastic lower highs, completing bearish or negative divergence, hinting that the buyers are losing their grip. Also pay attention to what happens here with the candle patterns. The Harami candle patterns that was created two days before confirming candle coming in play here, and all that happens. To close below this green candle. Very good positive sign. So with that, usually what comes in play is the potential turnaround. Now we start to make the lower lows, right? So what could happen here is with any rally, we should experience another push down. In rare cases, okay, what could happen here is one more fake high to be created before the flips. But again, it's very rare. Usually in such cases, the waves are inner, small pullback to cause some confusion, and then a deeper retrace down. So for me, sell the rallies is the plan on the EUR/CAD. What do you think about this one? Will the 1.50 hold and we see the price dropping down to 1.47 and 1.45, or do you think an all-time high is coming? Share your thoughts in the comment section below. The next one would be the gold. So following my analysis from the previous weekly forecast, I still anticipate to see the gold making the all-time high eventually. And there are two scenarios I want to see on gold in order to join. So yep, first of all is that my anticipation is we should get. one more, uh, an all-time high, I would say. Okay, and, um, with that, classical would be if we can do something like that— 3 descending waves. The first wave was biggest, second one is right now in creation, next one would be final. And here we will probably get some higher highs on the chart, lower highs on the indicator to create this divergence before the price will turn around. So with that analysis in mind, we go to the daily chart. And again, look what happens every time we get right on the Bollingers. So eventually the price makes a significant retrace, at least to the opposite band. Right now we have the upper band, and right now this is where the price is correcting itself, at least to the opposite Bollinger Band. But I do want to see the price going and making a little deeper pullback. How deep? We have the rising supportive line. We have the broken resistance that now acts as the support. And we have here a strong volume profile based zone. Ideally, we should see the gold making this push before taking the next rally. So this would be the first scenario, of course. But what also could happen here is that at the end of this current range, the gold, instead of making final dive before the rally, uh, would eventually break upside and regain the bullish momentum. So if it does something like that, makes the new bullish trend structure by making higher, higher lows, okay, this would start to behave as a supportive line, and any pullback there should be considered as an opportunity for a rally to the all-time highs. And the final one, the DAX, which I believe is completing right now these massive wavings before we get a new all-time high, or at least some sort of a double top here. And this bearish divergence taking place, I believe that once that hits the next sell-off should be massive. Okay, so the DAX, um, is yet under the bullish pressure on the short term. And dropping here to the weekly chart, we can plot Fibonacci expansion to see up to where we can expect these waves to go. So I take this current last ongoing trend, and as you can see, we did cross at above the 61.8, the next key zone is slightly higher here. Okay, and with that in mind, I do expect the trend to continue at least as long as the momentum maintains. Let me just zoom out a little bit so you can see them better here. There we go, here we are. Okay, so what happens currently, we did have the— on the 4-hour chart Three higher highs, higher lows, which attempt to break here. So as long as that low hold and we don't have the trend flipping, for me this is a potential bullish continuation closer to the previous mentioned zone which we saw from the weekly chart. As long again, as long as we hold this range breakout, right? We should be experiencing the further waves. Of course. It could be just a trap, and we do need to pay attention to how it develops. If it goes and completes here some fake high and bearish divergence, you know, and breaks these lows, then of course it all becomes just a trap attempt to rally. But as long as the range breakout managed to hold, there is a good opportunity for the DAX to go and achieve the all-time high that will connect to the weekly and the monthly analysis and the expectations. But this is my trading plan on the DAX. Let me know what your thoughts— will we see new, new all-time high on DAX, or is it about to crash sooner than expected? So that's it for this video. Thank you very much for your time watching it. I hope you find value in the opportunities I share with you. If you do, I have a request from you. Please hit the like button, drop some feedback in the comment section. Feel free to share this video with anyone who you believe can benefit or having value watching that. This video is open for the community, and thanks a lot for your help and your support, uh, in, uh, in my work and what I can— I bring to the channel. I also want to invite you to join us in our trading family, the Home Trader Club. Where you will get your access, as you can see on this very image, to full trading courses, real-time trading opportunities, real-time trading education, our trading community, myself, and so, so, so much more. Join us with the link below this video. Thank you once again, and I wish you a wonderful trading week and months ahead. Best to you and yours, and see you soon with more.