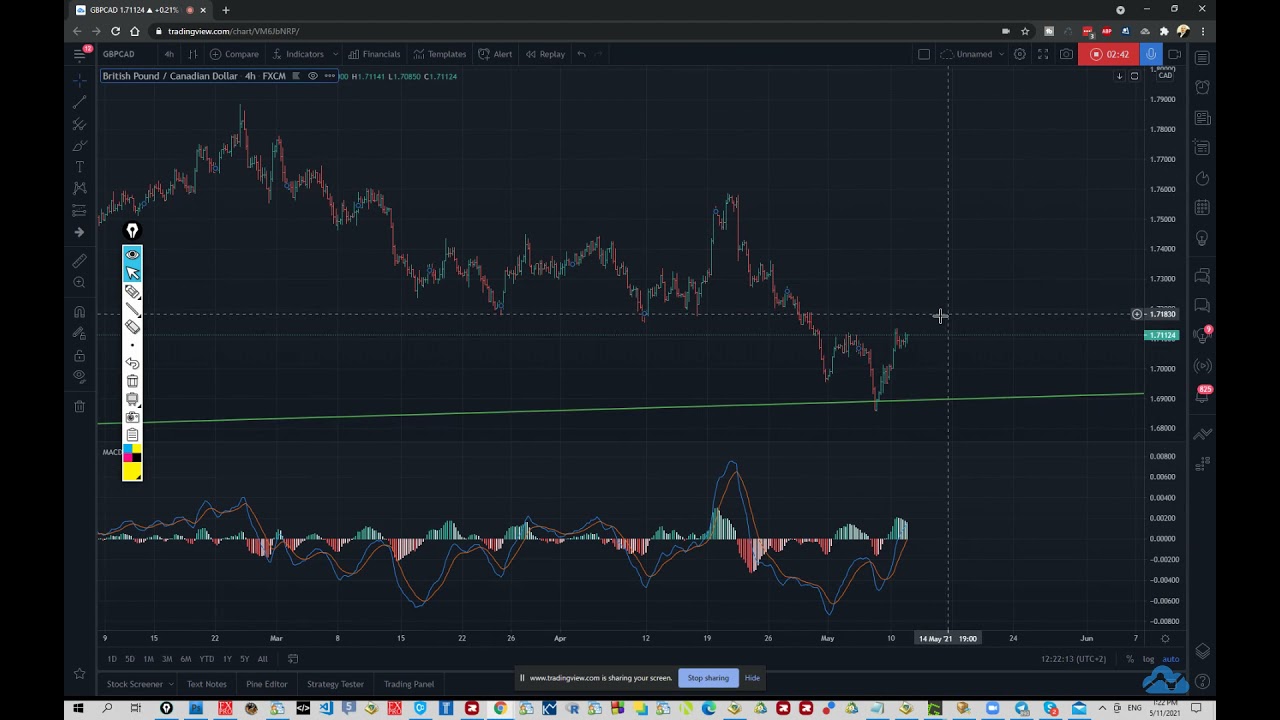
Jordan analyzes GBP/CAD's weekly triangle with multiple false breakouts, identifying bullish divergence on lower timeframes and a potential breakout above a critical 4-hour level. He outlines breakout pullback and swing entry strategies with target zones inside the consolidation range.
Chapters
What's up everyone, this is Jordan. Time for another hopefully interesting technical setup for you. Today we're going to talk about pound CAD, and basically I'm going to start here with the weekly chart because we can see the pattern attempted many, many times to go ahead and break out of what started here, right, as a triangle. At some point, breakouts, false breakouts up and down. Then we need to go ahead and adjust these lines. Adjust, adjust, adjust. It simply doesn't gain the momentum. Now the interesting part in my opinion is that we are back to this bottom line and looks like we're creating another false break. Let's just drop one line there like this, right, approximately. And this is what we're looking at, which means if we can find evidence on the lower time frames that this thing might be pushing upwards, we can be actually trading it. So yeah, now I'm moving the whole thing one moment. I'm trying to make it as accurate as possible. But yeah, this is what we get, right? This is the false break I'm referring to. So, uh, we have the divergences here, which is bullish divergence, definitely looks good. And basically the expectation from my side is for this thing to push higher. Dropping even lower, I'm able to find this divergence and now an attempt to go ahead and break. And so far we we managed to spike through this thing. As we can see, no close above, or maybe if it closed, it was just a few pips above it or so. But, uh, the important fact here is that we're most likely building some kind of impulse, which I really start to like. And on the very last part, again, this is our important high here. But on the very last part, after this amazing push to the upside, there is no divergence against us, at least no pending one. We do have a consolidation pattern. So if this thing actually manages to push one more time, creating divergences here, we look where we go, right? Straight above this 4-hour chart critical important level. So in other words, um, I guess pound CAD is as bullish as it could be. Higher time frames, lower time frames, everything is pretty much fitting together. Now, how exactly you're going to trade it, this is up to you to decide. Whether you want to be looking for some kind of short-term opportunities here, whether you want to be looking for potential breakout pullbacks, buying the pullbacks, whether you want to be buying here Right now with the breakout and protecting some kind of swing idea. Maybe this low, maybe that low, right? Uh, again, many, many ways for you to decide which way to go. And in terms of the targets, I wouldn't put it like this even though we don't have a new low here, because clearly we are still holding that zone, right? We never managed breakout of these 2 extreme zones, which means we can start looking for potential targets approximately inside this zone. So even if you're doing some kind of a swing, it would make sense in my opinion in terms of risk-reward ratio, right? Other people might be looking for this trend line to be broken, which could be also interesting in general, but in this specific case, giving it a bit of an angle in order to go ahead and break. Look where this breakout comes, right? And this is inside this massive zone. So breakout pullback could be then, uh, something to be done. But the trend line alone, I wouldn't bother with that in this specific case. So this is pretty much the idea. Um, if you like it, give it a shot. And of course, if you have any questions, let us know below in the comment section and we'll be happy to reply. Thank you.