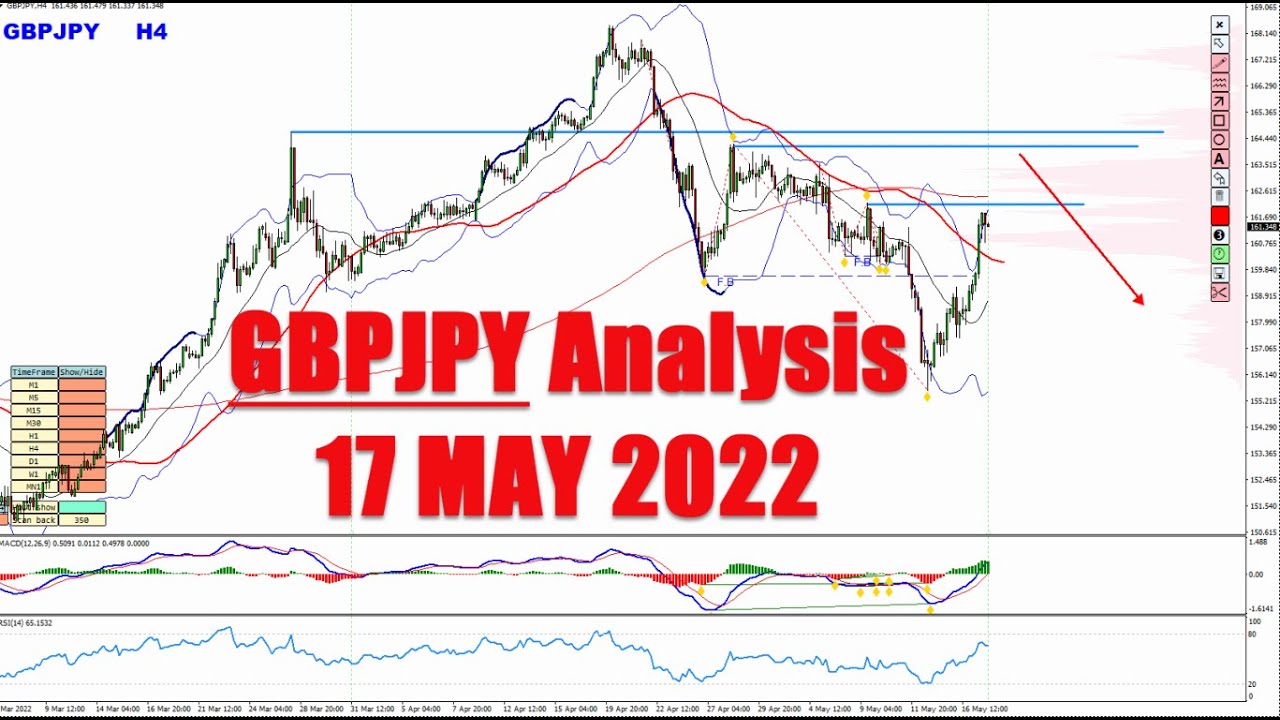
In this 17‑May‑2022 YouTube video, Vladimir Ribakov of Traders Academy Club delivers a follow‑up technical analysis of the GBP/JPY (pound‑yen) pair, building on his earlier weekly forecast. He begins by welcoming viewers, promoting his VIP price‑action course, and offering free custom indicators (the KTL indicator and a virtual trading pen). The core analysis focuses on two key price zones identified via volume profile: the first zone where bullish momentum previously reversed, and a second zone where a new sell opportunity may develop. Ribakov explains the expected price movement using an ABCD pattern, divergence, and a “flip” from higher highs to lower lows on lower‑time‑frame charts. He outlines two possible scenarios: (1) a classic ABCD completion leading to a sell, and (2) a slower climb without a clear ABCD, still generating a sell signal through higher‑highs turning into lower‑lows. Throughout, he encourages audience interaction (likes, comments) and reiterates the invitation to join his Traders Academy Club for real‑time trading ideas and education.
Chapters
Hello traders, how are you? Vladimir here from Traders Academy Club, and in this video, my analysis and price prediction for the pound yen. Today we are on 17th of May 2022. I hope you have a nice start of the trading, uh, week and, uh, This pound yen that I'll cover would be a follow-up to the weekly forecast. If you missed the weekly forecast, make sure to watch this video. You can find it directly in my channel. But before I go to the charts and explain everything and all the techniques behind it and what do I expect to happen next, if you are new to this channel, welcome to our amazing community. Please subscribe to the channel with the subscribe button below the video. And also I invite you to our trading family, Traders Academy Club, where you will enjoy from the full VIP price action course access, where you will enjoy from all our real-time trading ideas and the real-time trading education. Every single trading opportunity comes with a detailed, dedicated video explaining all the trading techniques behind it. Join our family with the link below the video in the description. And I hope to see you with us. And now let's go to the pound yen. As I said before, this would be a follow-up to the weekly forecast. If you missed this video, make sure you watch it in the channel so you understand the whole bullish and bearish analysis I did as we expected to see a rally from here. And now we are reaching the levels where I would expect to see a turnaround. Taking place soon. So if you missed this video, once again in the channel watch it, or right now in the right top corner of this video I'll put a direct link to make it easier for you. And also these very indicators that you see on my chart, the key trading level indicators based on the volume profile and my virtual trading pen, both of these indicators are available for you absolutely free Go to the description below this video and there are 2 links you will find there: KTL indicator and the virtual trading pen. Follow the links, download them, and enjoy them. So what do we have on the pound yen? So the first thing we wanted to do at the beginning of the week was the bullish direction back to the volume zone. Which you can see here, and the swing highs, the previous area where the buyers lost their control to the sellers, which is here. And the previous trend, it's here. So this is the first zone of interest, which— where we are right now. And this is the second zone of interest. In this area, I believe that the market will be building up the next sell opportunity. And the way I expect that to happen would be pretty much like that. That would be the ideal scenario. Okay, if we can get 2 waves here, uh, to complete this movement, get close to the previous swing highs, this is the ideal zone for us. Okay, and here to develop some divergence. From there, we'll be looking for a sell. One of the options would be the break below the ongoing supportive line or ABCD line. The other one would be to time that on the lower time frame. So let's say we climb here, and on the lower time frame you would start to see the flip. So from higher highs to lower lows, okay? All that to happen at this key zone which I was just talking about, okay? Then pull back and retrace. So basically something like That, okay, higher highs flipping to lower lows, pullback and move down. Okay, so this is the pound yen and how I would anticipate this movement. Let me know if you enjoy this video or if you enjoyed these pairs shared with you in the recent weekly forecast video. If you do, make sure you hit this like button, drop some feedback in the comment section. A few words, 15 seconds of your time, huge help to this channel and a big support in my work. So thank you very much in advance to all those of you who help. So once again, this becomes our key zone. We are right now at the volume area. The ideal scenario here would be, as I said, ABCD. Okay, now alternative scenario And that also could happen that it just continues slow climbs and not completing clear ABCD, and we would see this, um, lower— higher highs on the chart versus lower highs on the indicator. And as we get close to the desired area of the highs on the lower time frame, same principle of the flip from fake higher highs to new lower lows should be giving the, uh, the great call for possible sell continuations. So that's it for this video. Let me know what do you think about this pair. And as always, for any questions, I'm there for you. Just leave your question in the comment section below this video. And once again, I invite you to our trading family, Traders Academy Club. Enjoy the best offer, the best value we have to offer to you. Join us with the link below in the description. I wish you and yours all the best. Thanks for your time watching this video. I'll see you soon with more. Bye for now.