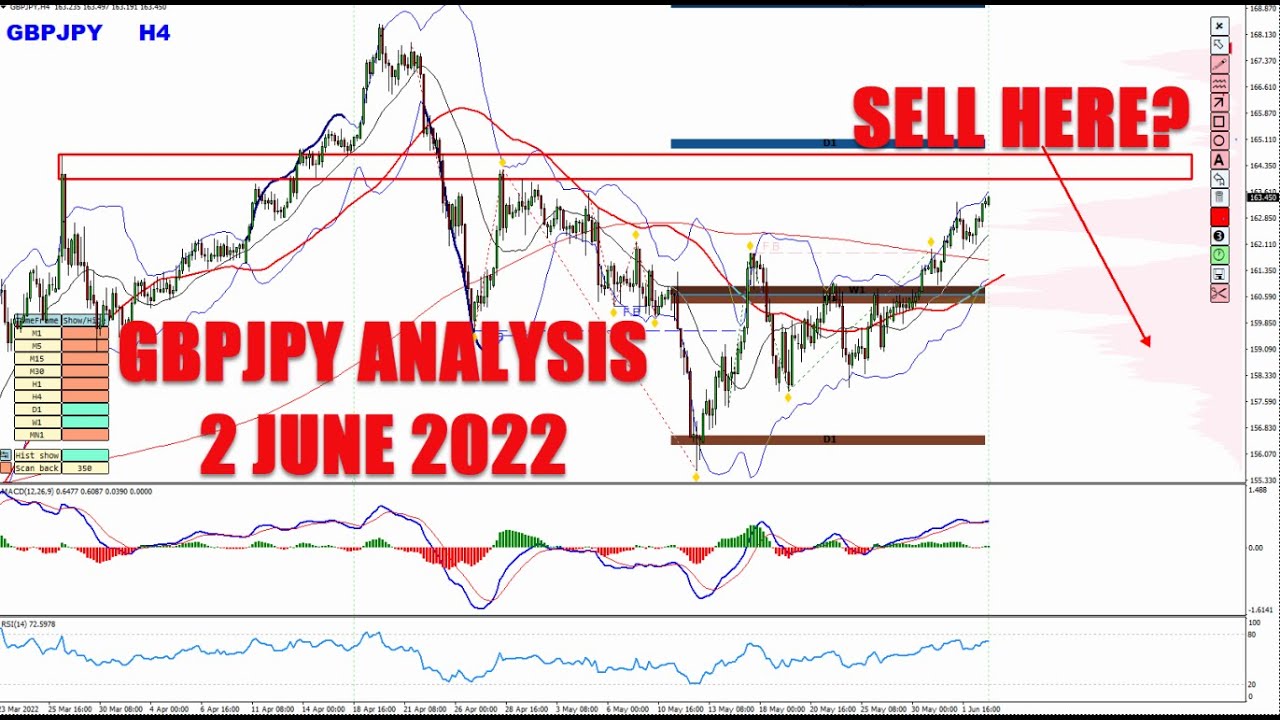
Vladimir Ribakov analyzes GBP/JPY across multiple timeframes, identifying a shift from uptrend to downtrend with bearish MACD divergence and lower highs and lows. He outlines two short entry strategies: aggressive on a break of the recent low, or conservative below the ABCD trend line, emphasizing proper risk management for each approach.
Chapters
Hello traders, how are you? Vladimir here from Traders Academy Club, and in this video I would like to share with you my technical analysis and price prediction on pound yen. This is a follow-up for the trading opportunities we discussed on the last recent weeks. And if you missed these videos on the pound yen, you can find directly in the channel. I'll put one link right now on the right top corner of this video so you can also watch it directly there. So what do we have on this instrument? Why is it so interesting? And why I believe something very interesting might be coming. Let's start talking about that. But before that, if you are new to this channel, welcome to our fantastic community. Please subscribe with the subscribe button below this video. And also invite you to our trading family, Traders Academy Club, where you will get your access to our free full VIP price action course, where you will enjoy from all the trading ideas delivered to you real time. Real-time trading education. Every single trading opportunity comes with a detailed dedicated video explaining the techniques, the exact techniques applied for these trading opportunities. Welcome to our trading family. Join with the link below this video in the description. So let's go to the pound yen, starting with the weekly time frame. After the massive 3-wave rally that we've had here, we came to a bearish divergence— higher highs on the chart, lower highs on the moving average. of the MACD. Following that, several weeks in a row of big bearish candles creating a beautiful lower highs, lower lows. Besides that, going to the daily chart, we make the flip of the price from higher highs to lower lows. Quick analysis of the previous highs of the rally brings us to here, and the high of the move down brings us right this area. So we are about to enter these key zones, as I was talking on the last videos. As I suggested, watch it in the channel if you missed it. We should have 2 waves down, 2 waves up, which indeed happens, and I believe it's coming to the end. By the way, this beautiful pen I am drawing on my chart right now, you can download for absolutely free together with the key trading level indicators Below this video in the description, follow the links of KTL indicator, key trading levels indicator, and the virtual trading pan. Download it, enjoy it. So going down to the 4-hour chart and remembering the beautiful daily zones. Okay, remember these areas? Let's go to the daily, right? These swing highs. Back to the 4-hour chart. This is the area. And now Look what happens here. The ABCD correction that we've had building here comes to the end with a potential building up divergence on the histogram for a flip from positive to negative to possible positive again. And the creation of higher highs on the chart versus lower highs on the indicator gives a great indication that the buyers are very likely going to disappear soon, uh, and getting weaker. Okay, so with all this information, what will we follow here? A price reaction, right? Buyers are currently in control. That's why they create higher highs, higher lows. At the moment their sequence would be, uh, broken, this is the moment. Aha, that's the aha moment. So for a more aggressive view, break of the recent low should be a great indication that the sellers are trying to take the control, and then sell the rallies becomes the plan. For more conservative view, a break below this ABCD line should be a stronger indication, and the next wave would likely be developing. Okay, so this is the follow-up for the pound yen. To be very clear here, as a lot of traders for some reason love to go super aggressive and try to be like on the pip, if a specific level is reached, does that necessarily mean that it's time to sell? For me, no. You can go aggressive. There is nothing wrong with aggressive. The wrong is when aggressive is applied with the same risk as conservative. That's a problem. So if you are risking 1% for your conservative setups and then aggressive setup come in and you want to try to very, very, very accurate entry and you risk 1%, that's a problem. Okay, uh, so aggressive and conservative for me, uh, are in a different, uh, plan for the risk management. Don't do these terrible mistakes in trading, and mainly don't think you are different. So many traders tried before you and failed. Why do you think it would be different for you? Let me know what do you think about the pound yen below in the comment section. If you have any question, let me know, of course. And please show your support back to this channel if you find them useful and helpful. Hit this little like button below. A few words in the comment section would be a great help. Feel free to share these with anyone who you believe can benefit by watching this video. And once again, welcome to our trading family, Traders Academy Club. Enjoy the best value we have to offer, and I hope to see you with us. Join us with the link below this video in the description, and, uh, I wish you good trading. Uh, all the best to you and yours, and I'll see you soon with more. Bye for now.