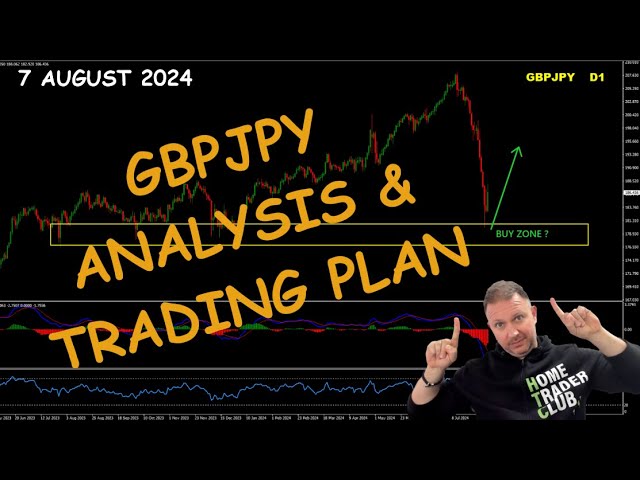
Vladimir Ribakov analyzes GBP/JPY after the pair bounced over 500 pips from a predicted support zone. He identifies extreme oversold conditions on daily and 4-hour charts and outlines three scenarios for the next move, proposing a short-term buying strategy based on support levels and moving averages.
Chapters
Hello traders, Vladimir here from Home Trader Club. In this video, I want to share my analysis and further trading plan on the pound yen, and it will also be sort of a follow-up on what we discussed on the recent weekly forecast. Let's begin. Before the charts, big thanks to 8K Broker for supporting our community to enjoy all the special offers we have with 8K Broker, including the access to Home Trader Club, the live trading rooms, all the trading education, trading systems, indicators, anything of your wish, please follow the link below this video in the description. Now let's take a look on the charts. As you remember, and if not, please make sure you watch the weekly Forex forecast on the last week, we were covering this zone as the key zone where the pound yen is expected to reach, and from there very likely we will experience bounces to the upside. So the pound yen reached the area, the zone we wanted to see, and bounces beautifully over 500 points since then. The question is, what is coming next? So for that, let's take a look inside the Home Trader Club members area and take a look on the market trends snapshot. The pound yen, which over the last months dropped more than 10%, and the last 7 days more than 5%, uh, the 24 hours, as you can see, we are positive 1.31%. Usually that's an indication that we are now in sort of, uh, let's say normalization of the price movement. And the reason is because when the numbers go beyond the acceptable deviation, at some point the market will look for ways to stabilize the moves, right? So this is what happens with the pound yen. Now, the beautiful part here is if we take a look, we do have a massive supportive zone here, demand area. But also pay attention to these levels as you can see them on the chart. Okay, so this is my KTLI, Key Trading Levels indicator. Look how beautiful this is based on the volume profile balance area. Look how beautiful the weekly and the monthly levels hold here. This is why this zone is so powerful. Besides that, we have the 180 round number psychological level touched and bounced. And besides that, we have— if we take a look on the Bollinger Band indicator again, the custom indicator of, of mine We have an amazing golden ratio, uh, here. We have the 3rd Bollinger Band duplication, uh, from the break of this candle. And if we move one candle right where it started to make the drop, it is a double duplication, okay, from this zone here, okay, which is again an amazing dynamic area that's based on the Uh, indication and the levels. MACD creates an absolutely new low while the RSI reaches the, um, below the 20, which is, as we know, very strong oversold conditions. And it's moving basically, it completes from one extreme to other extreme. Very likely to assume, unless something unexpected will happen on the market, that the market here will find a way to stabilize itself around this zone. With this idea in mind, if we drop down to the 4-hour chart to try to understand what is happening here on the 4-hour chart, we did ride on the lower Bollinger Band for more than 20 candles, right? You can see that once again here with marked with blue. Last time it happened was here and we got the bounce to the upper band. Last time it happened before on the upper right, what was here, and we all remember what happened since. So the way I see that, and as long as this low holds together with this key supportive zone based on the balance area, we had extreme oversold conditions on a daily chart, and the same applies on the 4-hour chart. And right now we bounced to the upside with 2 waves. The one of the scenarios I see from here, okay, that, that will be the acceptable price movement, is if the market makes 2 waves up, 2 waves down, and from there basically one more rally. We have this falling resistance line which is very likely to assume the market will try to reach, uh, in this normalization, back normalization case And I believe the moving average also, the dynamic moves of the moving average should provide here some good window for the rally. Other alternative scenario, the GBPJPY completes 3 waves, then pullback, and then longer corrective structure in 2 waves. And one scenario which is possible but sort of, I would say, the lowest probability but still could, could happen if we got one more strong reaction to the downside, which then is expected to clean the previous low and complete the condition of— sorry— of lower lows on the chart versus higher lows on the indicators, complete a normal basic divergence, and from there create a fast run to the upside. This is how I see the pound yen from here, and this is how I plan to trade my short-term buys on this one. Let me know what do you think about this pair, how do you expect this one to move from here, in the comment section. Thanks for watching, best to you and yours, and I want to take the opportunity to invite you to our trading family, the Home Trader Club. Get your access to our full courses, real-time education, and real-time trading opportunities. The link is below this video in the description. Once again, best to you and yours. Thanks for watching. I'll see you soon with more good trading. Bye for now.